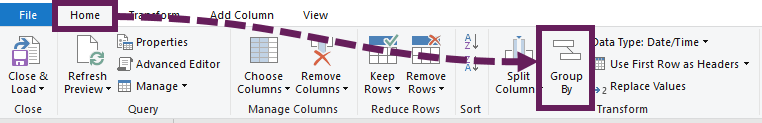
In this post, we look at the Power Query Group By transformation. Group By summarizes data by aggregating rows based on one or more columns.
In Excel, there are many ways to group and summarize data. We might use techniques such as:
- Functions – Dynamic Array functions along with SUMIF(S), SUMPRODUCT, or AGGREGATE.
- Pivot Tables
- Subtotal feature (Data > Subtotal)
In Power Query, Group By performs a similar task, but the purpose is slightly different. In Excel, we generally summarize to display a result; however, in Power Query, we summarize to reduce data to the optimal granularity level.
The Power Query Group By transformation is simple yet powerful. So, let’s get started.
Table of Contents
Download the example file: Join the free Insiders Program and gain access to the example file used for this post.
File name: 0116 Power Query Group By.xlsx
Watch the video

Scenario
The example file contains just one Table. The Table includes sales data for January 2019 with Date, Customer, Product, Sold By, and Value columns.
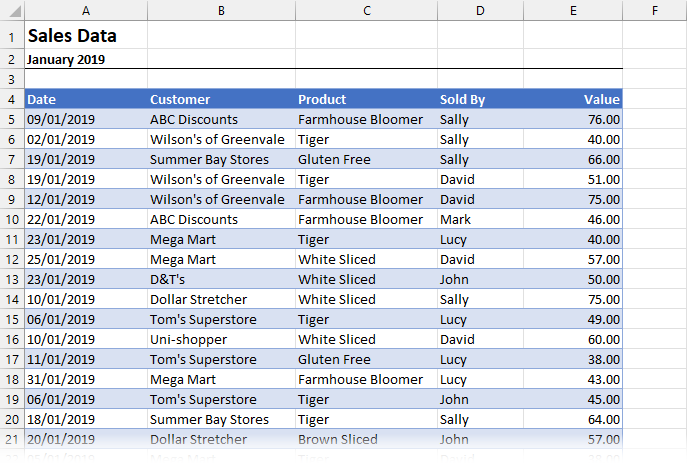
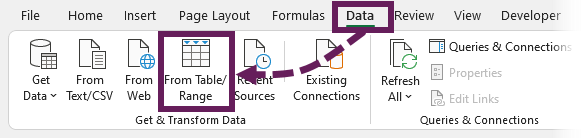
Select a cell in the Table and click Data > From Table/Range from the Ribbon to load the data into Power Query.
The data loads into the Power Query editor.
The Group By feature is found in two places:
- Home Ribbon: Home > Group By
- Transform Ribbon: Transform > Group By
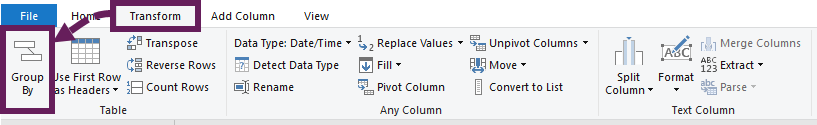
Choose either option to open the Group By dialog box.
Two views of Power Query Group By
The Group By dialog box comes in two forms:
- Basic: allows a single column and a single aggregation to summarize by
- Advanced: allows multiple aggregations based on multiple columns
The initial view depends on the number of columns selected within Power Query. If one column is selected within the preview window, the dialog defaults to the basic view; otherwise, the advanced view opens.
To switch between basic and advanced views, click the dialog box’s radio buttons.
We will look at both views in this section.
Basic Group By
To display the basic options, ensure the Basic button is selected.
In our example, let’s suggest we want to summarize our data to show the average product sale value. Select the following options: (these are shown in the screenshot below).
- Column to group by: Product
- New column name: Average Sale
- Operation: Average
- Column: Value
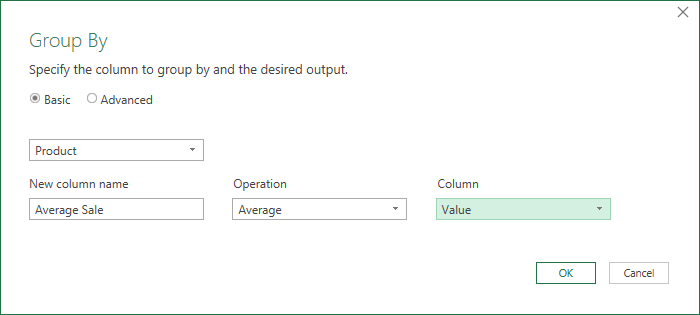
Click OK to close the dialog box and make the transformation.
The Preview Window looks like this:
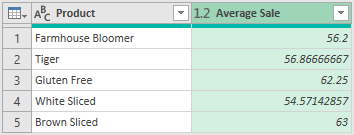
The table shows the unique items from the Product column and the average sale value for each.
In the example, we used the average aggregation. The operation dropdown has the following options:
- Sum
- Average
- Median
- Min
- Max
- Count Rows
- Count Distinct Rows
- All Rows (which creates a table of each grouped item)
Advanced Group By
Click the Advanced button in the dialog box to show the advanced options.
Advanced allows us to summarize and calculate based on as many columns as we need.
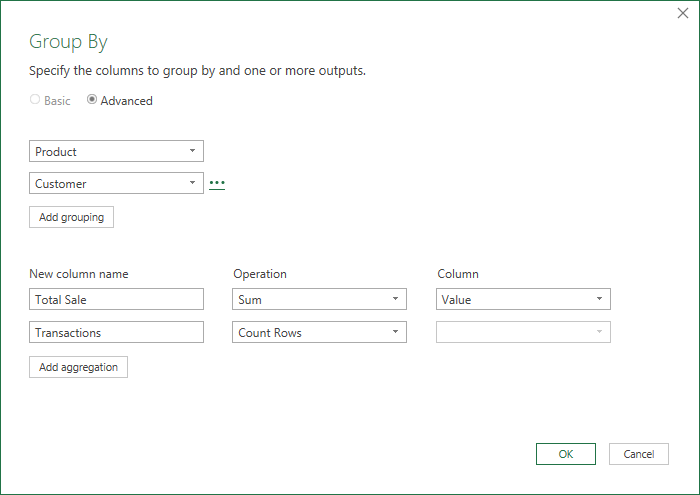
For this example, let’s say we want the total and count of sales transactions by product and customer.
Set the first section to include the Product and Custom columns. Click the Add Grouping button to add columns, or the three dots ( … ) to remove columns.
In the new column name section, apply the following settings:
- New column name: Total Sales
- Operation: Sum
- Column: Value
Click the add aggregation button, then set the new column as follows
- New column name: Transactions
- Operation: Count Rows
- Column: [not required for Count Rows]
Click OK to perform the transformation.
The Preview Window now looks like this:
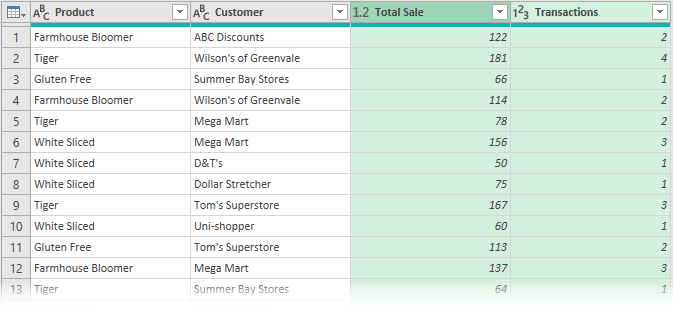
The table shows the unique items from the Product and Customer columns with the Sum and Count operators applied. While each column may contain duplicates, the combination of columns is unique.
Summarize Text
In the operations list in the dialog box, there are only numeric transformations (Sum, Average, Min, etc.). However, we can perform text aggregations too. We just need to make a few edits to the generated M code.
Let’s suggest we want a list of every person who sold to each customer. Apply the following parameters in the Group By dialog box:
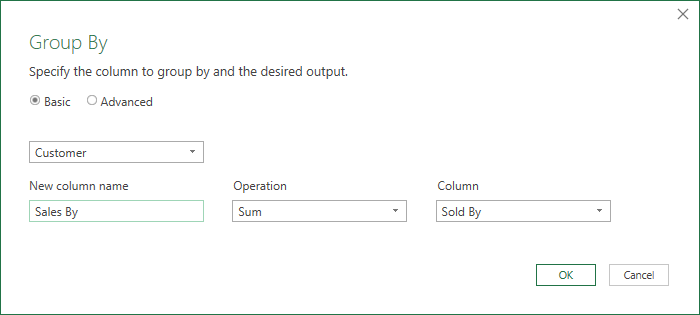
When clicking OK, it generates an error in the Sales By column, as Sum cannot be performed on a text value.
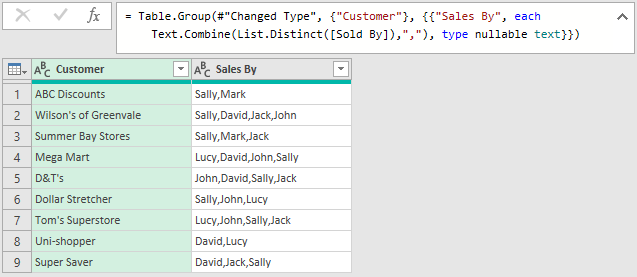
However, in the M code, we can change this:
= Table.Group(#"Changed Type", {"Customer"}, {{"Sales By", each List.Sum([Sold By]), type nullable text}})To this:
= Table.Group(#"Changed Type", {"Customer"}, {{"Sales By", each Text.Combine(List.Distinct([Sold By]),","), type nullable text}})We now have a list of salespeople for each customer.
This proves that even though text operations are not listed in the user interface, we can still edit the M code to achieve this outcome.
Conclusion
Hopefully, you agree, the Power Query Group By transformation is a simple yet powerful feature.
We have seen it works with numbers and text (if we make some changes to the M code).
Power Query primarily prepares data for use in Excel or a Data Model. Therefore, we tend to use Group By to reduce the amount of information to the lowest level of granularity required, rather than to create reports.
For other examples of Group By, check out these posts:
- Power Query – Combine rows into a single cell
- Power Query – Percent of total or category
- Power Query – Lookup value in another Table
For some advanced Group By techniques, check out this video: https://www.youtube.com/watch?v=jLpgt-wptH4
Read more posts in this series
- Introduction to Power Query
- Get data into Power Query – 5 common data sources
- DataRefresh Power Query in Excel: 4 ways & advanced options
- Use the Power Query editor to update queries
- Get to know Power Query Close & Load options
- Power Query Parameters: 3 methods
- Common Power Query transformations (50+ powerful transformations explained)
- Power Query Append: Quickly combine many queries into 1
- Get data from folder in Power Query: combine files quickly
- List files in a folder & subfolders with Power Query
- How to get data from the Current Workbook with Power Query
- How to unpivot in Excel using Power Query (3 ways)
- Power Query: Lookup value in another table with merge
- How to change source data location in Power Query (7 ways)
- Power Query formulas (how to use them and pitfalls to avoid)
- Power Query If statement: nested ifs & multiple conditions
- How to use Power Query Group By to summarize data
- How to use Power Query Custom Functions
- Power Query – Common Errors & How to Fix Them
- Power Query – Tips and Tricks
Discover how you can automate your work with our Excel courses and tools.
The Excel Academy

Make working late a thing of the past.
The Excel Academy is Excel training for professionals who want to save time.