The party was already in full swing; I was going to be late. Not fashionably late, just late.
When I finally arrived, rather than the usual “What time do you call this?“, I received the “Hey; you made it, that’s amazing. It’s great you could come. Let me show you around“. Nobody looked down at me for being late. They were just pleased that I was there and excited to tell me about everything that was going to happen.
Sounds like a nice party, right? You’re starting to wish you were there too, aren’t you? The good news is… you’ve been invited. Actually, you’ve just arrived.
The party I’m referring to is the group of people who in 2017 already knew and loved Power Query (or Get & Transform as it’s known in Excel 2016 and later). I can’t remember the first time I heard about Power Query, but I do remember it was in the same breath as Power Pivot. Then I heard it was an additional add-in I had to install. My first thought was “Sounds like too much effort; it’ll probably be rubbish anyway. I don’t really need it. I’ve got VBA; I can do everything I need in VBA. It’ll just be a waste of time“. The irony being that had I looked into Power Query at that moment it would have saved me so much VBA frustration.
Time passed. I noticed that more and more Excel experts were talking about it. Ken Puls, Mynda Treacy, Oz du Soliel were all talking about how amazing Power Query is. I dug in my heels. I thought to myself “I don’t work in a world of dirty data, I don’t spend hours cleaning and fixing data problems. Plus ‘data transformation’ sounds like something I would need a computer science degree for“.
Excel 2016 was released and Power Query was integrated directly into the main Excel application (though it was now known by the name of Get and Transform). I had no excuse, there was no download or installation required. I opened up the Power Query interface. My instant reaction was “Too hard, don’t understand it, see it was a waste of time, I knew it would be.”
Twelve months pass, I happened to see some free webinars and YouTube videos, no harm in checking them out – BOOM!!!! (That was the sound of my mind being blown). My brain starts thinking again; it’s the first rational Power Query thought I’ve had: “PowerQuery isn’t just for dirty data, it’s for all data! Data transformation can be as simple as unpivoting a table, or combining all the files in a folder. I suddenly realized this could save me hours of time and a lot of annoying VBA code. Why had nobody told me about this before? … oh wait … they did!”
This is how I finally arrived at the Power Query party. Since 2017, the popularity of Power Query has expanded. Everybody is willing to share their knowledge because the impact of Power Query is just too big. Since 2017, I have immersed myself in Power Query and Power Pivot and now I rely on these tools to save time every day.
A 2020 survey at datachant.com revealed that average Power Query users saved 76 working days per year. That is 30% of work time! That is HUGE!!!!
Unfortunately, if you ask most Excel users if they use Power Query they will look at you blankly, they have no idea what it is. I want to take my part in changing that. In 2018 I wrote a comprehensive Power Query series, now I’m updating that series so that I can keep spreading the Power Query message, and changing lives. Over the next few posts we will be focusing on Power Query.
By the way, if you’re reading this, then chances are you’ve just arrived at the Power Query party too. All I can say to you is: “Hey, you made it, that’s amazing. It’s great you could come. Let me show you around“. 😁
What does Power Query do?
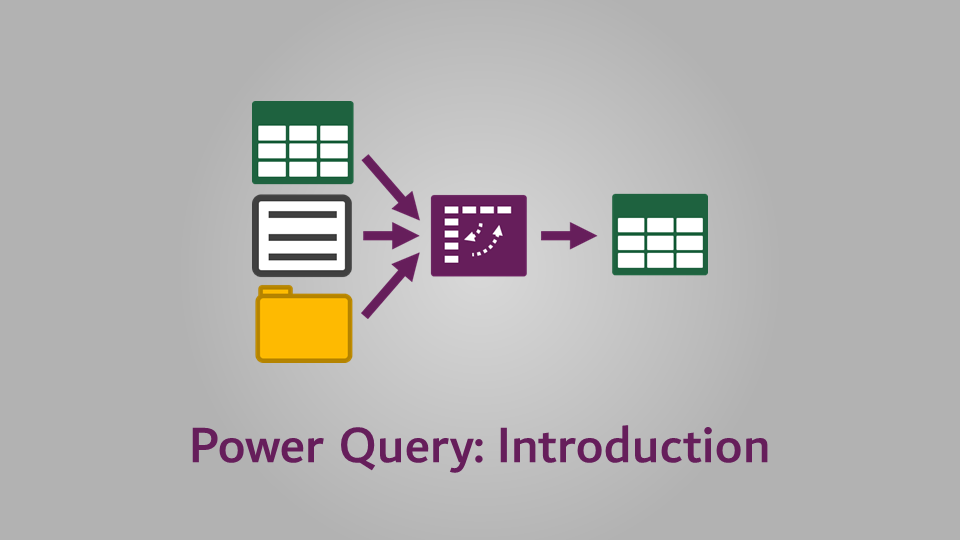
Power Query is an ETL tool (“a what?” I hear you say). ETL stands for Extract, Transform and Load. Let us look at each of those words individually to get a better understanding of what it means.
- Extract – Data can be extracted from a variety of sources; databases, CSV files, text files, Excel workbooks, specific cells on the same worksheet, websites and even some PDFs. Basically, if there is data stored somewhere in a structured or semi-structured format, Power Query can get to it and pull it out.
- Transform – Once the data has been extracted in the previous step, it can be cleaned up (e.g., remove spaces, split columns, change date formats, fill blanks, find and replace) and reshaped (e.g., unpivot, remove columns). When data is extracted from different sources it is unlikely to be consistent, the transform process optimizes the shape of the data so it is ready for use.
- Load – Once the data has been extracted and transformed, it needs to be put somewhere so that you can use it. From an Excel perspective, it can be pushed into a worksheet, a data model, or another query.
In short, Power Query as an ETL tool, takes data from different sources and turns it into something which we can use.
So. Power Query sounds pretty useful already. But here is the best part. Once the ETL process has been created, it can be run over and over again with a single click. Which can save hours of work every week.
Some examples of what Power Query can do
Does it all sound a bit abstract and confusing so far? Let me share some examples to give you a real taste of what is possible.
Example 1:
Let’s say that every day you receive a CSV file with an updated price list. Normally you would open the CSV, copy the relevant columns into your spreadsheet then use a lot of LEFT and RIGHT formulas to split some text fields, finally, you use a PivotTable to present the information in the correct format.
You could easily undertake the transformation steps in Power Query to extract the CSV data and clean it up. But the best part is you could refresh the data every day, by simply saving the CSV file in the correct folder location, then just clicking refresh. BOOM! It’s a one-click dream!
Example 2:
Each month you receive 30 Excel workbooks from different divisions of the business, all the workbooks are in the same format. You open each spreadsheet and copy the data into a master spreadsheet to consolidate into a master report.
With Power Query, you can easily consolidate the data from all the workbooks with a few clicks in the user interface. You don’t need to open up each worksheet, you don’t need to copy and paste. Then when it comes time to update, just save all the files in the same folder, and consolidate with one click.
Example 3:
Your business has just acquired a new company. As is often the case, their software system is different to the rest of the company. Management currently has no intention of changing IT systems. Your job is to create a summarized sales dashboard for the whole company each week. Sounds like it could be a lot of work.
With Power Query you can import data directly from each system and with the use of a mapping table, create a dashboard that can be refreshed with a single click.
What is the difference between Power Query and Get & Transform?
The average user doesn’t use the word “Query” to describe the tasks they undertake. Put the word “Power” in front and nothing is any clearer. Maybe this is why Microsoft changed the name to Get & Transform in Excel 2016 and placed it in the Data ribbon. I am sure they were trying to give the user more clarity. While it may be labelled Get and Transform in Excel 2016 and later, the name Power Query appears to have stuck with the Excel community.
How difficult is Power Query to learn?
So, how difficult is it to learn Power Query? If you are thinking that you need to be a programmer, or at least an Excel expert, you would be wrong. Power Query has an easy-to-use interface which is designed for everyday users.
There is a bit of a learning curve, but most of that is learning what each button does.
It takes years to become competent in VBA macros, it takes months to become competent in Power Query. Since 80% of what we did with VBA can be achieved with Power Query, then that is the place to focus.
If you want to go deep into Power Query, there is a programming language called “M” which you could learn. But you can harness 99% of the power without needing it at all.
Time to get started
As mentioned earlier, a study in 2020 found average users saving 76 days per year. With that statistic in mind, let’s stop talking about it, and start using it.
Since Power Query has such a life-changing impact, we have a training course that shows how to use it to save enormous amounts of time. Check it out here: https://exceloffthegrid.com/academy
Read more posts in the Introduction to Power Query series
- Introduction to Power Query
- Get data into Power Query – 5 common data sources
- DataRefresh Power Query in Excel: 4 ways & advanced options
- Use the Power Query editor to update queries
- Get to know Power Query Close & Load options
- Power Query Parameters: 3 methods
- Common Power Query transformations (50+ powerful transformations explained)
- Power Query Append: Quickly combine many queries into 1
- Get data from folder in Power Query: combine files quickly
- List files in a folder & subfolders with Power Query
- How to get data from the Current Workbook with Power Query
- How to unpivot in Excel using Power Query (3 ways)
- Power Query: Lookup value in another table with merge
- How to change source data location in Power Query (7 ways)
- Power Query formulas (how to use them and pitfalls to avoid)
- Power Query If statement: nested ifs & multiple conditions
- How to use Power Query Group By to summarize data
- How to use Power Query Custom Functions
- Power Query – Common Errors & How to Fix Them
- Power Query – Tips and Tricks
Discover how you can automate your work with our Excel courses and tools.
The Excel Academy

Make working late a thing of the past.
The Excel Academy is Excel training for professionals who want to save time.
I felt the same way about Tables (or Lists as they were originally called). I shunned them for longer than I care to admit, mostly because I didn’t like how they defaulted to the alternating row color theme. Knowing what I know now, I will happily clear that theme as many times as necessary to take full advantage of what Tables have to offer.
I wonder what current features we are complaining about that we will later come to rely on?
I just leave the default colours now, as it’s a useful way to know what each Table is. Or maybe I’m just lazy.
If I’m building an application with a Table as part of the UI, then I will change to another color.