We’ve looked at a few Power Query transformations in this series, but now we are going much further. In this post, we look at the simple Power Query transformations available from the main menus.
Unfortunately, we can’t cover everything in this post; there are just too many options available. Also, more complex Power Query transformations are worthy of more focus and included in future posts in this series. However, by the end of this, you will have hundreds of easy Power Query transformations in your toolkit.
Table of Contents
Microsoft made Power Query’s menus contextual. Depending on the item selected, menu options appear, disappear or be disabled accordingly. For example, if you select a column with a text data type, the date and number related transformations are not available.
One confusing part about the menus is that the same action appears in multiple places. This is because the UI designers have tried to group similar items. Therefore, since some transformations could be categorized in various places, the buttons are included in all those locations. For example, Use first row as headers is available in the Home > Transform section and the Transform > Table sections of the ribbon.
As you work with Power Query, you will likely encounter other menus not covered in this post. But this should provide you a suitable start.
As Power Query is continuously updated, it is possible the screenshots may appear slightly different from your version of Excel. And, you may have icons that I don’t, and vice versa.
Without further ado, let’s start looking at what is available to us.
Home Tab
First, let’s look at the Home tab.
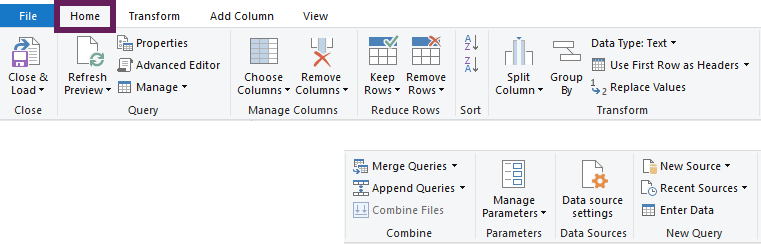
The Home tab contains query and application settings (e.g., Refresh Preview), along with common transformations. We are only looking at transformations in this post; therefore, we will only cover the Manage Column, Reduce Rows, Sort, Transform and Combine sections of the Home menu.
Manage Columns
The Manage Columns section contains two icons, each including two further options.
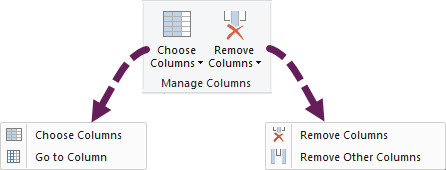
Choose Columns – selects the columns to be retained in the query
Go To Column – selects a specific column. This is not really a transformation as it selects a column in the preview window without adding any transformation steps into the query. The same could be achieved by clicking the mouse on a column header.
Remove Columns – removes the selected columns.
Remove Other Columns – removes all columns except those selected.
If you’ve been reading carefully, you might wonder what the difference is between Choose Columns and Remove Other Columns. Both commands keep the selected columns, so what’s the difference? In short, nothing! There is no difference; the M code is exactly the same.
However, from the perspective of a user’s thought process, there is a difference. Look at these two sentences:
- “These are the columns I want to keep.”
- “I want to remove all columns except these.”
They are subtly different in approach but lead to the same result in Power Query. So, I can appreciate why both exist even if they provide the same result. This also illustrates how many Power Query menus work; they are based on what a user might be trying to achieve.
Remove or Remove Others – does it matter?
Now that I’ve got you thinking a bit. Here is a question for you… are the following the same?
- Select the first column and click Remove Other Columns
- Select all columns except the first and click Remove Columns
What do you think? Are they the same?
The answer is… No, they are not the same. Let me explain why.
Let’s assume we have a Table with three columns labeled Column1, Column2, and Column3.
If we Select Column1 and remove the other columns. The M Code looks like this:
= Table.SelectColumns(Source,{"Column1"})However, if we select Column 2 and Column 3 and remove them (i.e., leaving Column1 remaining), the M Code looks like this:
= Table.RemoveColumns(Source,{"Column2", "Column3"})This isn’t just a different line of code achieving the same result. For example, suppose a new column is added to the source data. The new column might be called Column4. When we refresh the query as usual. What’s going to happen?
- Remove Other Columns ensures Column1 is the only column remaining (i.e., column4 has also been removed).
- Remove Columns removes Column2 and Column3, which means that Column1 and Column4 are remaining.
This concept is important and is found repeatedly in the Power Query options. As we apply steps that have both the Remove and Remove Other versions, we need to think about what will happen if somebody adds more columns; this ensures you choose the best option for your scenario.
Reduce Rows
Reduce Rows removes data rows by keeping or removing rows that meet specific criteria.
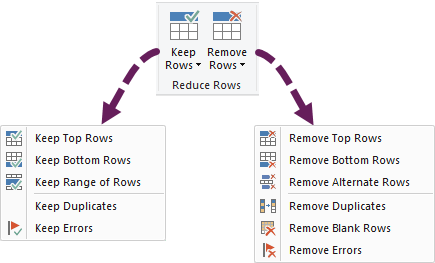
The first three items in both menus lead to another window, which allows us to set the number of rows to keep or remove.
- Keep Top Rows
- Keep Bottom Rows
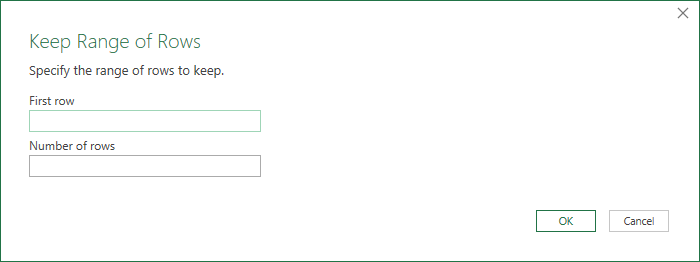
- Keep Range of Rows
- Remove Top Rows
- Remove Bottom Rows
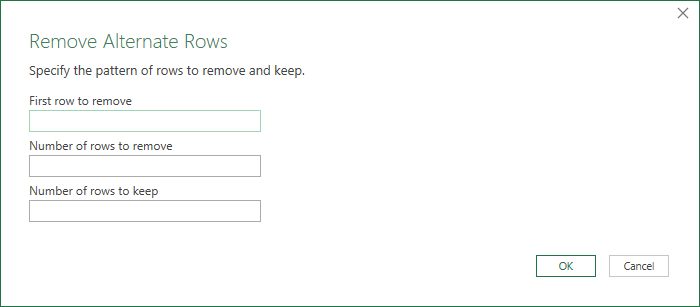
- Remove Alternate Rows
As an example, the window for Keep Range of Rows looks like this:
Or the Remove Alternate Rows looks like this:
The remaining menu items do not lead to another dialog box.
- Keep Duplicates
- Keep Errors
- Remove Duplicates
- Remove Blank Rows
- Remove Errors
For these transformations, the steps are automatically added without the need for further user input.
Sort
The Sort transformation is similar to Excel’s sort feature, but there is a subtle difference in how the sort order is applied.
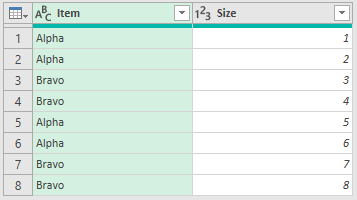
Let’s assume we have some basic data (see screenshot below):
If we sort by Column1, then separately sort by Column2, what should happen? In Excel, if we applied two different sorts, they would be sorted by Column2, as that was the last column sorted. But not so with Power Query.
If you remember, Power Query reduces steps to be as efficient as possible. Sorting by Column1, then by Column2, applies this as a single step and the result will look like this.
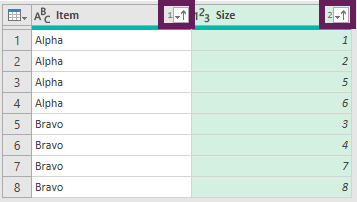
Notice that the result is sorted firstly by Column1, then by Column2. The sort order can be seen by the small numbers next to the arrows (highlighted in the screenshot above)
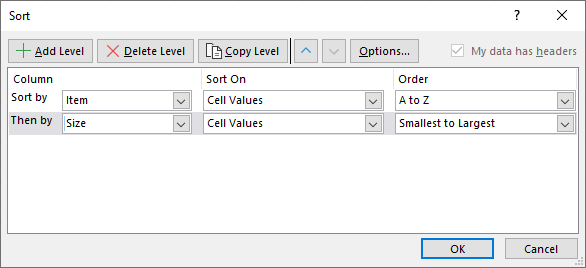
Therefore, Power Query’s sorting is like the functionality we find in Excel’s Sort window.
If there is at least one step between the first sort and second sort, Power Query will not combine them as they are seen as separate steps.
Other sections of the Home tab
The Transform section of the Home tab contains buttons for transformations also found within the Transform tab. This post is already long enough, so, we will not duplicate these descriptions. Instead, you can find full details in the section below.
Within the Combine section, there are two major transformations; merge and append.
- Merge Queries are an advanced transformation to join data from different tables into a single view. Find out more about this transformation here: https://exceloffthegrid.com/power-query-lookup-values-using-merge/
- Append Queries are another advanced transformation to stack multiple queries of the same layout into a single view. Find out more here: https://exceloffthegrid.com/power-query-combine-append-queries/
Transform
Next, let’s turn our attention to the Transform tab.
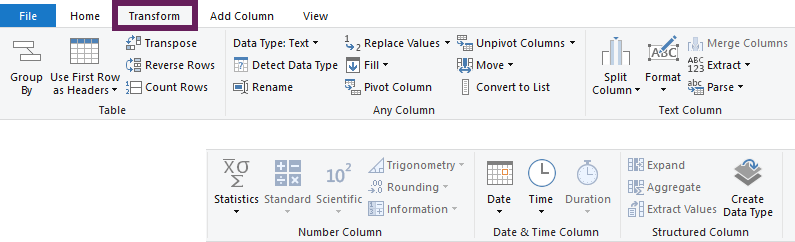
The sections we are looking at include Table, Any Column, Text Column, Number Column, and Date & Time Column.
The section entitled Structured Column relates to custom data types. We are not coving these in this post; therefore, to find out more, check this out: https://www.myonlinetraininghub.com/power-query-custom-data-types.
Table
The Table section applies transformations to the entire table, not just the selected columns.
Group By is a method to summarize the data in various ways. Clicking the icon opens the Group By dialog box.
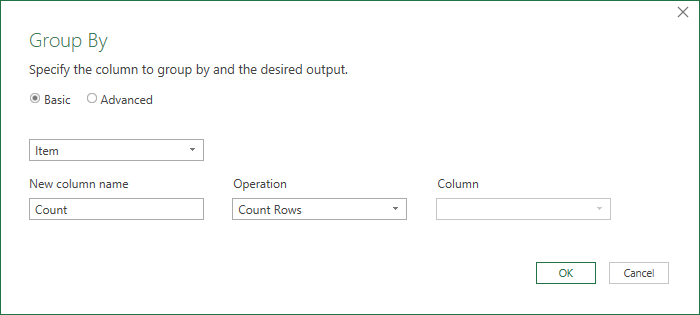
From this dialog box, we can select the columns to summarize by and the aggregation calculations to perform on other columns.
Group By is a very powerful transformation. Check out this post for more advanced examples of this transformation: https://exceloffthegrid.com/power-query-group-by/
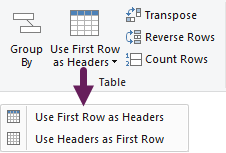
Use First Row as Headers makes the first data row the column header. We often use this when importing data from a named range, or anytime Power Query cannot guess what the column headers should be. Depending on our default settings, Power Query may auto-apply this step when importing data.
Use Headers as First Row demotes the header to become the first row of data.
Transpose works similarly to the Excel function; it switches the columns for rows and vice versa.
Reverse Rows puts the rows into the opposite order.
Count Rows drills down to a single number providing the count of the number of rows in the query.
Any Column
The Any Column section contains many useful transformations.
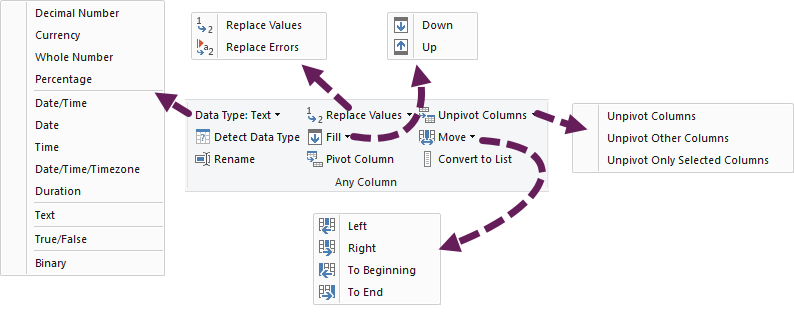
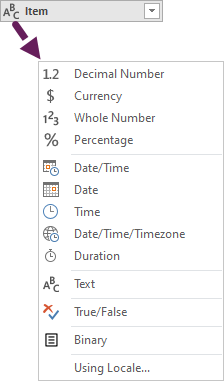
Data Type – use this option to change the selected column’s data type. It has the same effect as clicking the data type icon within the column header.
Detect Data Type – Use this option to have Power Query guess the data type by analyzing the data in the column. Depending on your default settings, this step may be auto-applied when importing data. Remember, Power Query won’t always get it right, so it’s often better to explicitly select the data type using the option above.
Rename puts the selected column header text into edit mode. This is the same as double-clicking the column header.
Replace Values is very useful; it operates like Excel’s Find & Replace functionality. Clicking the icon opens the Replace Values window. In the screenshot below, the Advanced options section has been expanded.
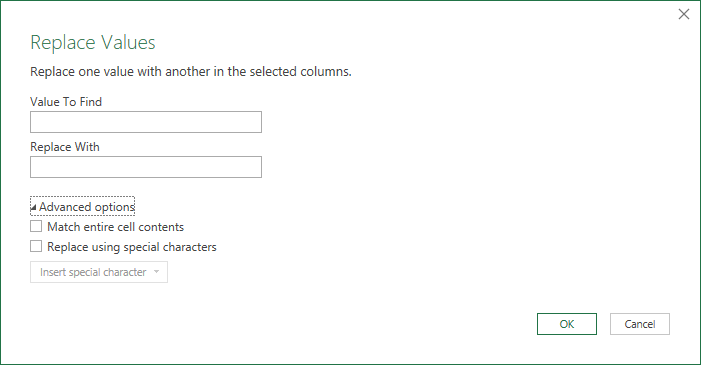
Replace Errors operates the same as Replace Values. However, it only applies to data containing errors.
Fill Up / Down fills every null cell in the column with the value above for Fill Down or below for Fill Up.
Pivot Column will Pivot the data based on the selected column.
Unpivot Columns can be used to convert information into a flat file table. More on this transformation can be found here: https://exceloffthegrid.com/power-query-unpivot-data/
Move is used to move columns left or right across the screen. This has the same effect as dragging the column with the mouse.
Convert to List converts the selected columns to a List of values; this is similar to drilling down into a table. Lists are a helpful method for more advanced transformations.
Text Column
The functions to transform text are contained in the Text Column section.
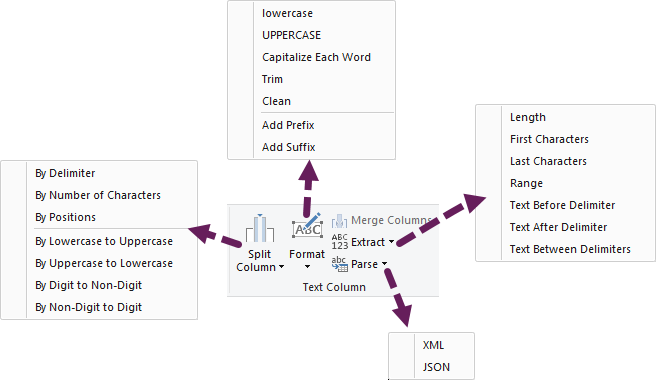
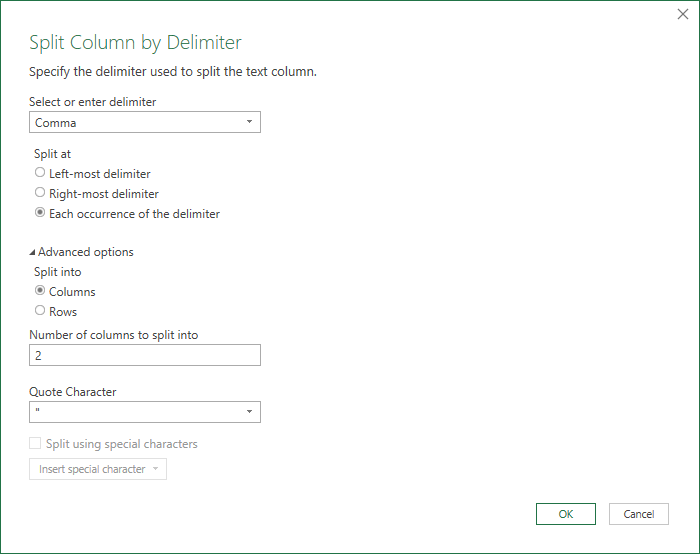
Split Column is used to separate a part of a text string from another text string. Splitting creates additional columns for each split of the string.
There are lots of options for splitting text. The top three items all open a new window.
- By Delimiter
- By Position
- By Number of Characters
As an example, the Split Column By Delimiter window looks like this. In the screenshot, the advanced options section is expanded to show even more transformations.
The bottom four items in the Split Column submenu do not have an additional settings window.
- By Uppercase to Lowercase
- By Lowercase to Uppercase
- By Digit to Non-Digit
- By Non-Digit to Digit
These four transformations are applied directly to selected columns without any further options.
Format has options to:
- Change how the text looks (e.g., Uppercase, Lowercase)
- Trim and clean to remove spaces and non-printable characters
- Add Prefix and Add Suffix add a fixed string to the start or end of an existing text.
These are all useful transformations to clean data before performing other transformations.
Merge Columns requires two or more columns to be selected. Clicking the icon opens the Merge Columns window, which contains the additional settings.
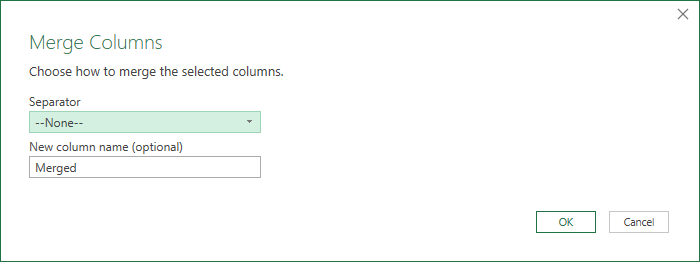
The separator drop-down provides some default options (Colon, Comma, Equals Sign Semi-Colon, Space, and Tab), along with the ability to select a custom separator.
Extract contains options to keep parts of a text string while discarding others. Options include:
- Length (similar to LEN function in Excel)
- First Characters (similar to the LEFT function in Excel)
- Last Characters (similar to the RIGHT function in Excel)
- Range
- Text Before Delimiter
- Text After Delimiter
- Text Between Delimiters
Parse provides advanced text filtering for XML and JSON file formats.
Number Column
No matter which industry you work in, I’m sure there are transformations in the Number Column section which will be useful to you. However, given the range of transformations, you will unlikely use them all.
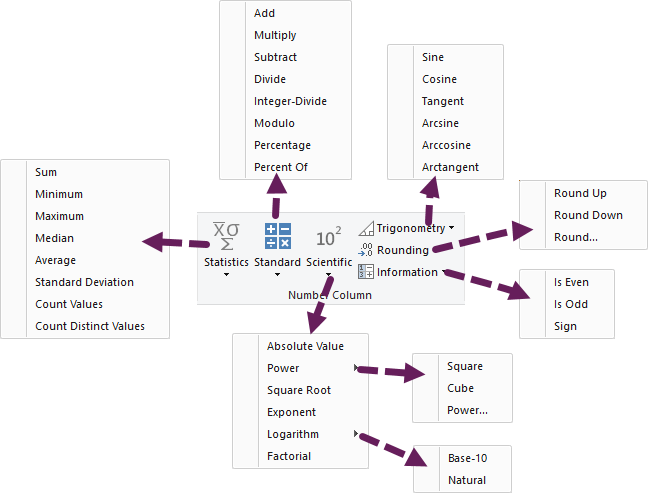
Statistics drills down into the values to provide statistical information about a column (e.g., Sum, Minimum, Max, etc.).
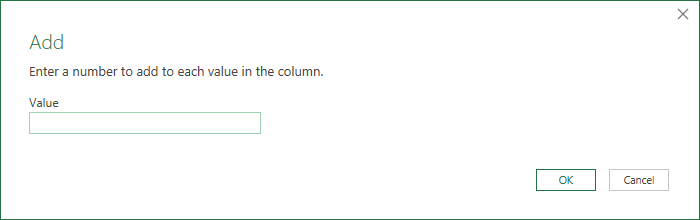
Standard performs calculations on the numbers. As an example, selecting Add opens the Add window. Entering a value and clicking OK, adds that value to every number in the column.
Rounding provides options to Round Up, Down, or to a specific number of decimal places. Please be aware, Power Query uses bankers rounding as the default round method.
Information checks if a value is Odd, Even, Positive, Negative, or Zero.
Scientific and Trigonometry transformations are helpful for more advanced mathematics.
Data & Time Column
The Date & Time Column section contains numerous transformations to deal with dates, times, and durations. In Excel, dates are tricky to work with, but within Power Query, we now have plenty of tools to turn our data into something more usable.
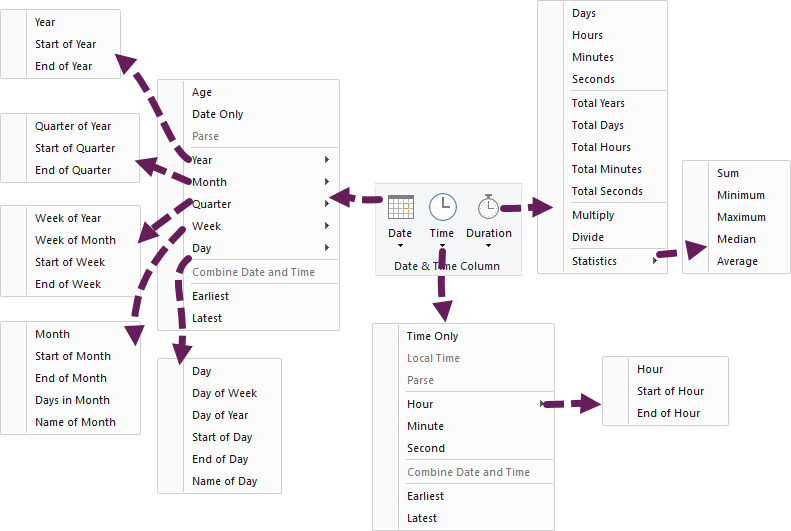
Date contains lots of options for transforming dates. All the options are shown in the screenshot above.
Some of my favorite transformations from this section are:
- Start of year (Date)
- End of year (Date)
- End of month (Month)
- Month name (Month)
- Week of the year (Week)
- Day of the week (Day)
Basically, it is possible to generate every categorization conceivable from any date.
Time contains the options to get the hours, minutes, seconds, etc., from a column formatted as time or DateTime.
Duration contains options to convert durations into Days, Years, Minutes, Seconds, etc.
Add Column
Transform vs. Add Column tabs
Just take a few seconds to compare the Transform and Add Column ribbons; there are a lot of similar-sounding icons here. So, what’s the difference between them?
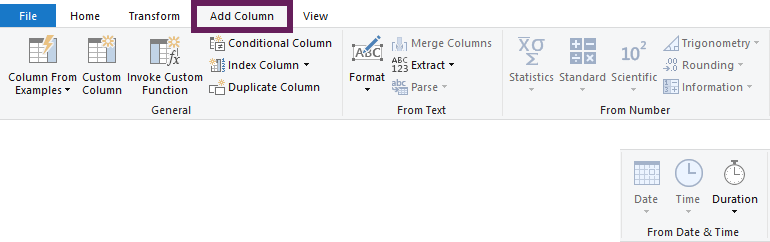
Selecting an icon from the Add Column tab will (you’ve guessed it) add a column. Icons on the Transform tab, transform the selected columns without adding new columns.
We won’t duplicate the descriptions; to find out what a specific icon does, read the equivalent description in the Transform section above.
Add Column has some unique buttons not found in Transform; let’s look at these.
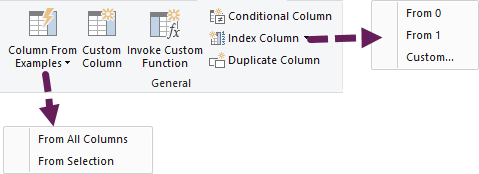
General
The General section provides more advanced functionality.
Column from Examples uses Power Query’s logic to identify data patterns and apply them to the remaining rows. The example below demonstrates that by providing the desired outcome for the first row, Power Query guesses the pattern and applies this to the remaining rows.
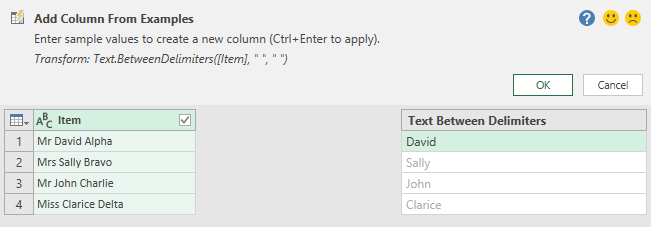
The function that Power Query used to transform the text is shown at the top. If the values are not as you want, keep providing examples for Power Query to work with.
Custom Column enables us to use M-code formulas on the data. We’ll cover some basic versions of these in this post: https://exceloffthegrid.com/power-query-formulas/.
Invoke Custom Function allows us to execute our own Power Query custom functions. This is an advanced technique. Look at this post for more details: https://exceloffthegrid.com/power-query-custom-functions/.
Index Column adds a column with an index number. This is also useful for more advanced techniques.
Duplicate column creates a duplicate version of the selected column.
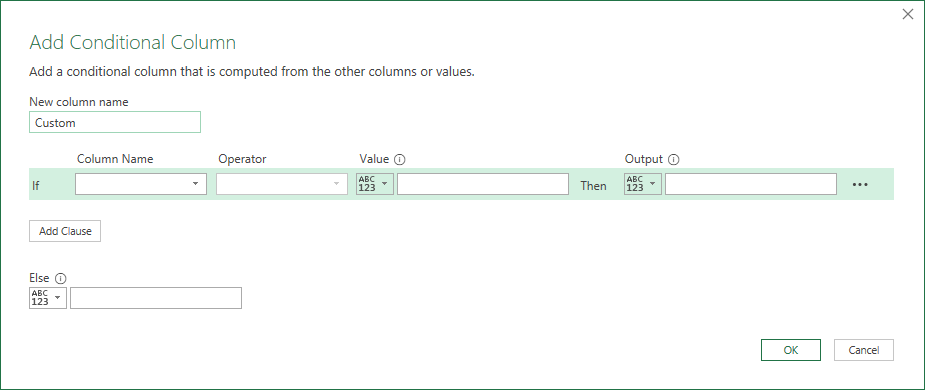
Conditional Column allows us to use logic to generate values meeting specific criteria. Think of it as Power Query’s basic version of Excel’s IF function.
Filtering
One of the most common types of transformations is filtering a column.
The filter menu is contextual; therefore, the menu items displayed depend on the column’s data type. For example, the screenshot below shows the menu for a text column.
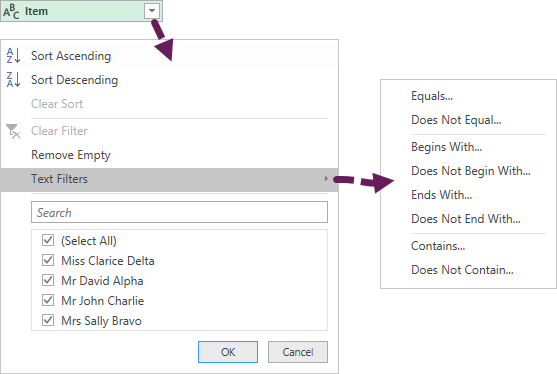
The filter options are similar but not the same as those found in Excel. For example, in Excel, there is a filter for “Top 10…”, for which an equivalent does not exist in Power Query. This is not because Power Query lacks functionality but there are different ways to achieve the same result.
Other Power Query transformations
Common transformations can be found on other menus too.
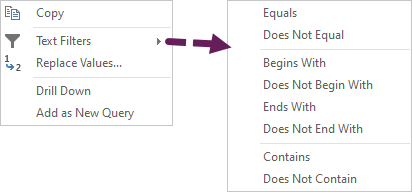
Right-click Column Header
Right-clicking on the column header displays a contextual menu. Look at the example below – this is the menu for a text column.
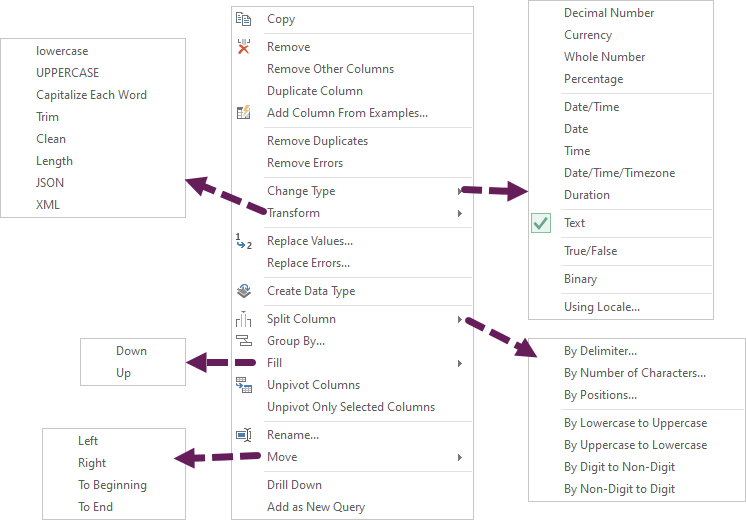
All of these transformations are available within the main ribbon, but the right-click menu provides a faster way to access many common transformations.
Table icon
In the top left of the Table is a small table icon. Click that icon to reveal the most popular table transformations.
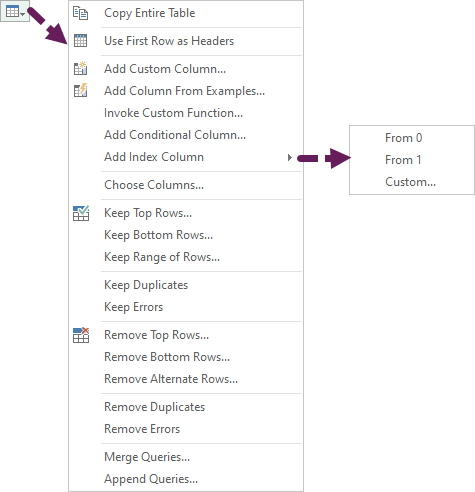
All of these transformations are available in the main menu.
Change data type
Clicking on the icon to the left of the column header displays the menu to change the column’s data type.
Right-click individual value
Finally, right-clicking on any cell within the Preview Window also leads to a contextual menu.
The example below shows the options for a text column.
Wrap-up
Wow, that was quite a lot to take in.
We have seen that there are hundreds of different Power Query transformations available. But we don’t have to remember them all; we just need to know what Power Query is capable of.
If you need to, you can return to this post again and see the options.
Read more posts in this series
- Introduction to Power Query
- Get data into Power Query – 5 common data sources
- DataRefresh Power Query in Excel: 4 ways & advanced options
- Use the Power Query editor to update queries
- Get to know Power Query Close & Load options
- Power Query Parameters: 3 methods
- Common Power Query transformations (50+ powerful transformations explained)
- Power Query Append: Quickly combine many queries into 1
- Get data from folder in Power Query: combine files quickly
- List files in a folder & subfolders with Power Query
- How to get data from the Current Workbook with Power Query
- How to unpivot in Excel using Power Query (3 ways)
- Power Query: Lookup value in another table with merge
- How to change source data location in Power Query (7 ways)
- Power Query formulas (how to use them and pitfalls to avoid)
- Power Query If statement: nested ifs & multiple conditions
- How to use Power Query Group By to summarize data
- How to use Power Query Custom Functions
- Power Query – Common Errors & How to Fix Them
- Power Query – Tips and Tricks
Discover how you can automate your work with our Excel courses and tools.
The Excel Academy

Make working late a thing of the past.
The Excel Academy is Excel training for professionals who want to save time.