This post looks at how to Resize an Excel sheet. It’s a common requirement for users and is especially useful when creating dashboards for different-size monitors. Every office I have ever worked in has been an equipment battleground. It didn’t matter what the equipment was; it just had to be better than everybody else. A new keyboard, Read More
Category: Dashboards
How to calculate Top 10 with formulas in Excel
Top 10 lists are a common form for displaying information, especially on dashboards and summarized reports. It is easy to create a top 10 in Excel when working with sorted data; just cell link to the top 10 items in the list… easy! It’s also relatively simple when using AutoFilter, Tables, and PivotTables, as it Read More
Create multiple checkboxes instantly with VBA
Checkboxes placed onto the face of the worksheet are an excellent way for users to interact with a spreadsheet. Each checkbox can be linked to a cell, so that when clicked the value in the cell changes between TRUE and FALSE. But if you have a lot of checkboxes to create it becomes a real Read More
Create dynamic chart titles with custom formatting
Titles are an overlooked aspect of many charts. A bland title misses out on so much rich information which could be used to enhance a users understanding of the report. Here is an example of bad and good chart titles: The 2nd chart title adds additional insight and provides a much richer experience for the Read More
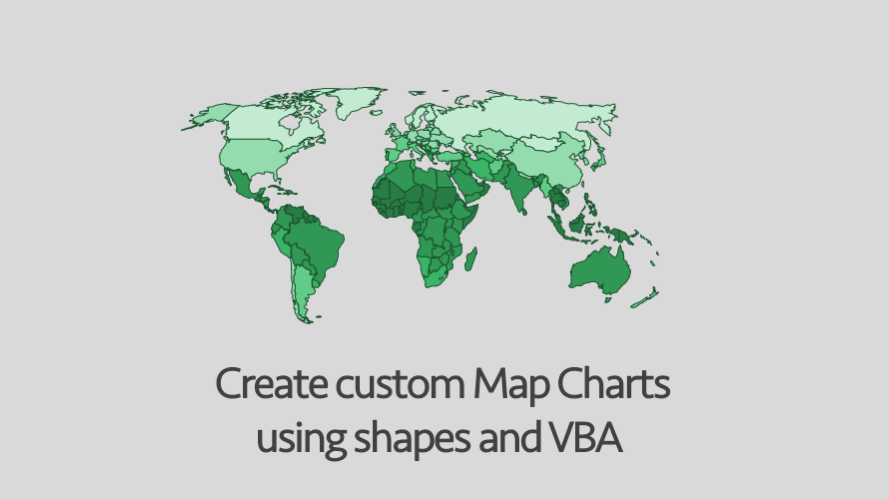
Creating custom Map Charts using shapes and VBA
Whenever I see promotional images for expensive BI Dashboard software, they always show the same thing – a map with countries or regions highlighted in different colors. It sends the subtle message that maps are the pinnacle of Business Intelligence (whether they are or not is a different matter altogether). Until Excel 2016, these Map Read More
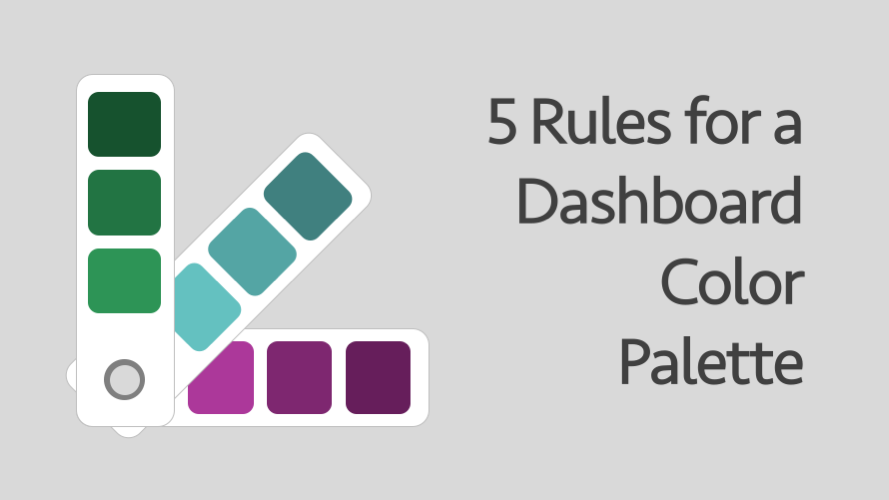
5 rules for a dashboard color palette
In this post, I would like to consider the use of colors in a dashboard (or, for that matter any analysis tool which uses colors to highlight areas of interest). Everybody believes they have good taste, even though everybody has different tastes. When choosing colors for a dashboard the key consideration is not your taste Read More
Highlight specific rows in a table
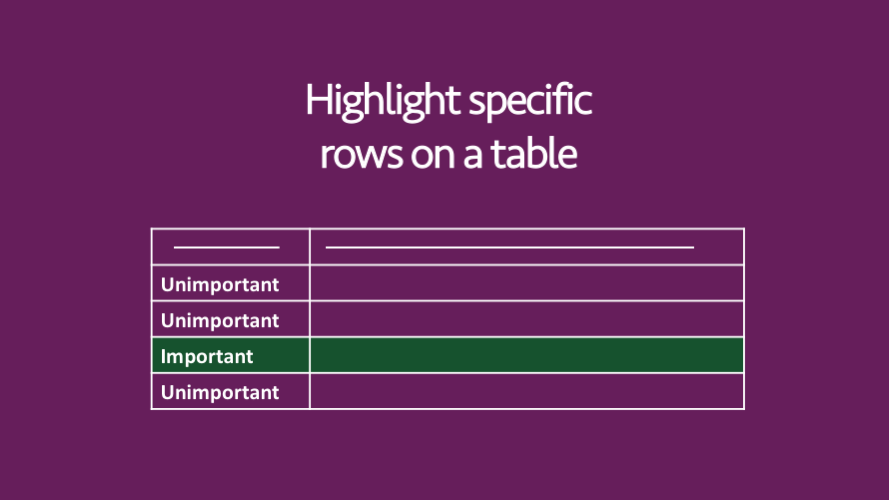
In this post, I would like to pick up the example we looked at last week. We saw that it is possible to highlight specific values in a bar chart. This makes it very easy for the reader to see the key information quickly. In this post, we will consider a similar goal, but for Read More
Highlight specific bars in a bar chart
Sometimes in a chart we want to highlight certain bars so the reader can quickly see the important information. An example would be to highlight our company when it is compared with its competitors (see the chart below). In this chart, it is very easy to see how Fox Books compares to its competitors. There Read More
The fastest way to create Bullet Charts
My first experience of Bullet Charts came from reading Information Dashboard Design by Stephen Few in 2007. This was the year I started to get serious with dashboards. Initially, to create Bullet Charts I used the 3 stacked bar/column charts approach. Later, I moved to using the two-axis stacked column where possible, but in general, Read More
Excel’s hidden camera tool
The camera tool is probably one of the most underutilized tools in Excel. The reason it is underutilized is because it is hidden. This simple tool will take a picture of a range of cells and place the picture of those cells on another part of the workbook. You can move, re-size and add picture formatting options the picture. Read More