Often as Excel users, we can look across at Power BI and see the convenience of having a sharable web-based dashboard. It’s nice to have each person viewing a dashboard without affecting other users. We don’t have anything similar in Excel… or do we?
Normally, if we share an Excel Workbook saved in OneDrive or SharePoint, every change made by a user updates the file. Therefore, it affects everybody else viewing the workbook at the same time.
We could email the report to all the users, but that is not keeping a single version of a file. Plus, if it’s a live report, we could be emailing it every day!
So, how can we create a view-only interactive dashboard from Excel, which is linked to one source? Let’s find out.
Table of Contents
Watch the video

Acknowledgments: The method shown in this post is from Chris Webb’s presentation to the Toronto Excel Meetup Group (https://www.youtube.com/watch?v=csclBVcLGJk). Please watch the video; it’s got some amazing techniques.
Get the sharing URL
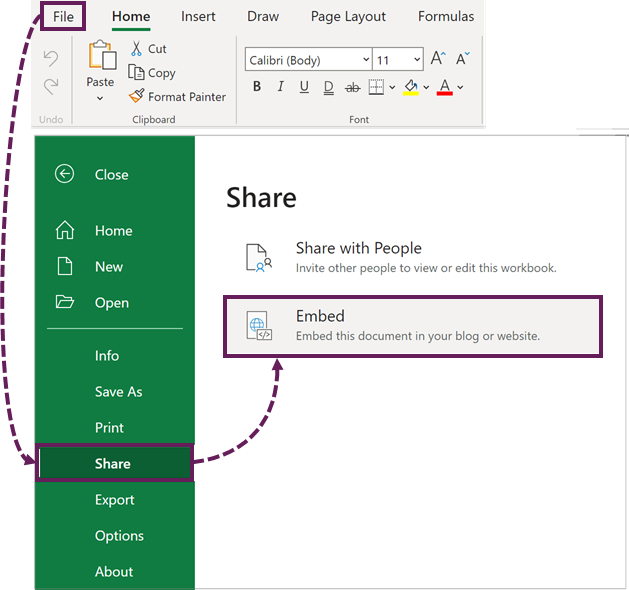
Open the Excel workbook in Excel Online from One Drive for Business or SharePoint. Note: It must be in Excel Online, as the options don’t exist in Excel Desktop.
In Excel Online, click File > Share > Embed
The Embed dialog box contains various settings.
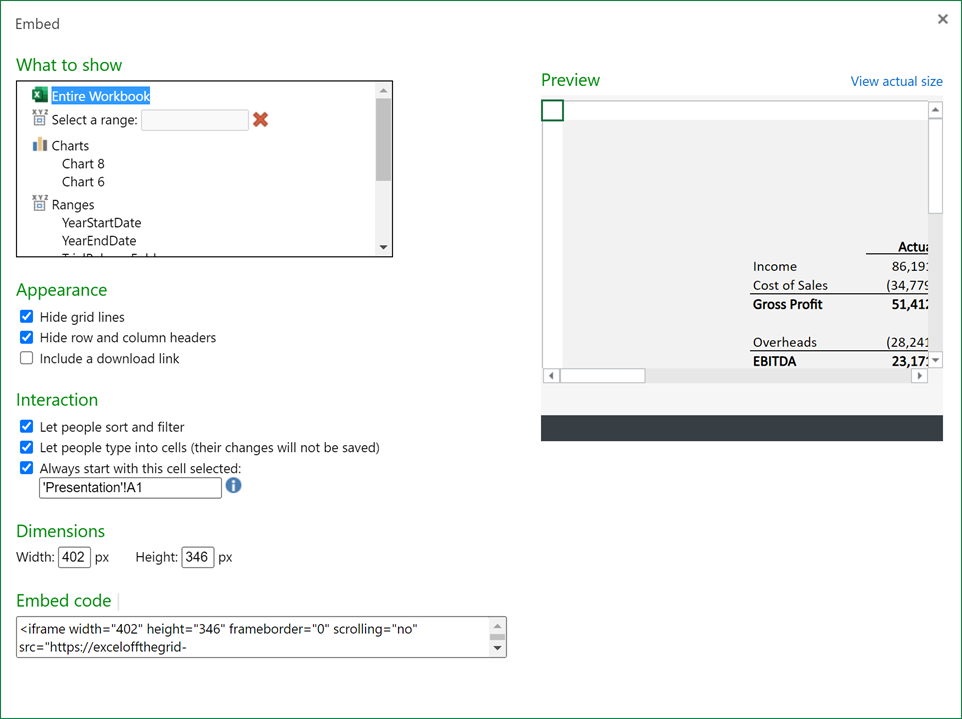
- What to show – Select an Entire Workbook, or restrict to a specific range, or chart
- Appearance – Decide whether to:
- Hide gridlines
- Hide row and column headers
- Include a download link
- Interactions – Determine how users can use the worksheet
- Let people sort and filter
- Let people type into cells
- Always start with a cell selected
- Dimensions – Define the width and height of the HTML iframe. We are not using an iframe in this post, so we can ignore this setting.
After making these selections, we can see the Embed Code at the bottom of the window. Copy this code and paste it into a text editor.
Viewing the dashboard
The Embed code looks something like this:
<iframe width="402" height="346" frameborder="0" scrolling="no" src="https://exceloffthegrid-my.sharepoint.com/personal/mark_exceloffthegrid_com/_layouts/15/Doc.aspx?sourcedoc={xxxxxxxx-xxxx-xxxx-xxxx-xxxxxxxxxxxx}&action=embedview&AllowTyping=True&ActiveCell='Presentation'!A1&wdHideGridlines=True&wdHideHeaders=True&wdInConfigurator=True&wdInConfigurator=True"></iframe>At the start and end of this code are the iframe tags. These are for embedding the Excel workbook into a webpage. But we don’t want to do that; we just want to share the dashboard. Therefore, we need to delete these elements
<iframe width="402" height="346" frameborder="0" scrolling="no" src="https://exceloffthegrid-my.sharepoint.com/personal/mark_exceloffthegrid_com/_layouts/15/Doc.aspx?sourcedoc={xxxxxxxx-xxxx-xxxx-xxxx-xxxxxxxxxxxx}&action=embedview&AllowTyping=True&ActiveCell='Presentation'!A1&wdHideGridlines=True&wdHideHeaders=True&wdInConfigurator=True&wdInConfigurator=True"></iframe>This leaves just the section we need.
https://exceloffthegrid-my.sharepoint.com/personal/mark_exceloffthegrid_com/_layouts/15/Doc.aspx?sourcedoc={xxxxxxxx-xxxx-xxxx-xxxx-xxxxxxxxxxxx}&action=embedview&AllowTyping=True&ActiveCell='Presentation'!A1&wdHideGridlines=True&wdHideHeaders=True&wdInConfigurator=True&wdInConfigurator=TrueCopy and paste the remaining code into the address bar of a web browser.
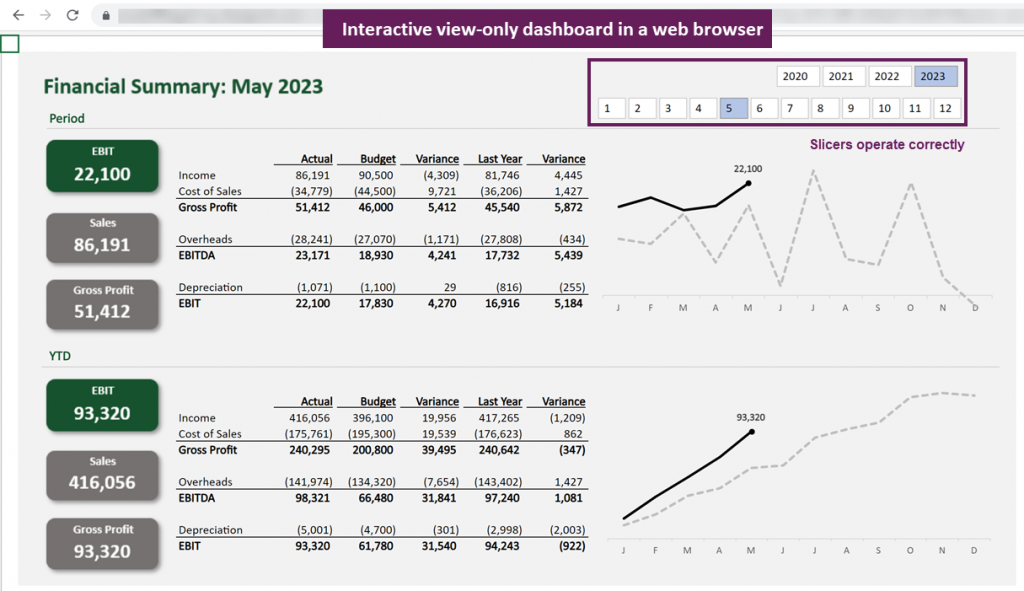
BOOM! Our Excel dashboard is now available in full screen for users to interact with. Slicers work, and formulas update, but no changes are saved.
We don’t need a website; we can simply send the URL to users, who can view the reports.
URL Customization
The URL includes the settings we applied in the Embed dialog box. Therefore, users can edit the URL and apply other settings if they want to. This might not be ideal for your situation, so be aware that this could be a risk in your scenario.
The following URL shows how the settings are applied. There is a & separating each setting.
https://exceloffthegrid-my.sharepoint.com/personal/mark_exceloffthegrid_com/_layouts/15/Doc.aspx?sourcedoc={xxxxxxxx-xxxx-xxxx-xxxx-xxxxxxxxxxxx}&action=embedview&AllowTyping=True&ActiveCell=’Presentation’!A1&wdHideGridlines=True&wdHideHeaders=True&wdInConfigurator=True&wdInConfigurator=True
The following is a list of settings we can use:
- wdHideSheetTabs=True
- Hides the sheet tabs displayed at the bottom of the workbook
- If excluded, the tabs are displayed.
- wdAllowInteractivity=True
- Allows users to interact with the workbook (e.g., Table filtering, PivotTable filtering, slicers, etc.)
- If excluded, interactivity is allowed by default.
- Item=itemName
- Only displays a named item, such as a named range, chart, table, or PivotTable.
- Replaced itemName with the name you want to display
- If excluded, displays the entire workbook
- ActiveCell=CellName
- Determines which cell and sheet are active when the workbook opens in the browser.
- Can be a cell reference or a named range.
- The syntax is: ‘Sheet%20Name’!A1 (%20 represents a space character)
- If no active cell is provided, the last saved view is shown
- wdHideGridlines=True
- Hides worksheet gridlines
- If not set, it defaults to false. Will respect if already hidden the gridlines in the original file.
- wdHideHeaders=True
- Hides the column and row headers.
- If not set, defaults to false
- wdDownloadButton=True
- Includes the Download button in the bar at the bottom so users can download a copy of the workbook.
- If not set, the default is false
Row-level security??
Power BI has row-level security; therefore, users only have access to the data they are allowed to see. However, using the method in this post, every user can view all the data.
The only way to restrict the data in Excel is to create different versions of the report and have separate URLs for each.
Conclusion
In Excel, we can create an interactive, view-only, web-based report from Excel, similar to those in Power BI. However there are limitations for security, and we can only apply this using Excel Online.
Related Posts
- 5 rules for a dashboard color palette
- How to make Waffle Charts in Excel that work EVERYWHERE!
- Move data between workbooks (Power Automate+Office Scripts)
Discover how you can automate your work with our Excel courses and tools.
The Excel Academy

Make working late a thing of the past.
The Excel Academy is Excel training for professionals who want to save time.
Hey Mark,
The dahshboard you used above as example well deserves a blog post independently to show us how to make it. Looks simple and sophisticated.
Wouldn’t you think about it?
BR,
Erdem
Thanks for the suggestion Erdem, a few people have asked for that. So I will put it on the list of ideas.