Whenever I see promotional images for expensive BI Dashboard software, they always show the same thing – a map with countries or regions highlighted in different colors. It sends the subtle message that maps are the pinnacle of Business Intelligence (whether they are or not is a different matter altogether). Until Excel 2016, these Map Charts were not available natively in Excel. As a result, the BI Dashboard software stood out as being something which was more advanced, it had the “WOW” factor.
As you will see in this post, with a few images downloaded from the internet and some lines of VBA we can create our own custom Maps Charts in Excel. Our Excel dashboards can now have that “WOW” factor too. This solution should work in any version of Excel which can run Macros.
Even if you have Excel 2016 with Maps Charts built in, you may still want to follow this article. The built-in Map Charts are amazing, but at the same time have various limitations, so this approach may better meet your requirements.
In this post, you will find the World Map Template, which is available to download for free, but also instructions on how to create your own Map Charts. My goal for this post is to give you the tools, skills and knowledge to construct your own custom Map Charts.
Introducing the World Map Template
I want to share with you the World Map Template file. This template includes a world map, in which the countries change color when the values associated with those countries change. The functionality within this template can be applied to any map, or any shapes. Whether your map is of states, school districts or by geographical factors, this template can be adapted to any scenario.
Download the example file: Join the free Insiders Program and gain access to the example file used for this post.
File name: 0167 Map Template.xlsm
Using the World Map Template

I must say Thank You to www.freeworldmaps.com for allowing me to use and distribute their World Map images within the World Map Template. This is also a great site to get your hands on other maps.
Try out the template for yourself. The countries in the map are formatted according to the names and values in Columns Q and R. The formatting applied is based on the fill color and left border color in Cells T2 – T8.
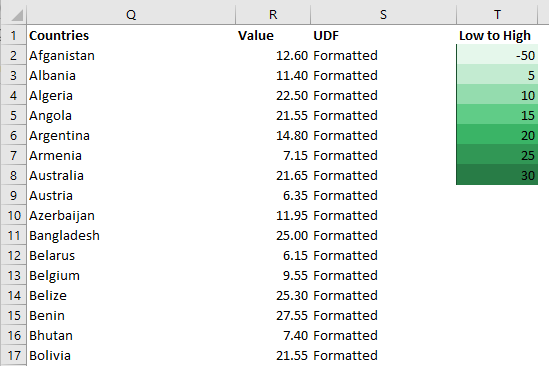
Changing the values in Column Q, or changing the colored banding in Cells T2 – T8 will change the formatting of the countries on the map. The ColorToShape function (which I created using VBA) in Column S is the trigger which drives the functionality.
For the functionality to work, the values in column Q must be identical to the names of the shapes on the map. If the ColorToShape function is applied to a name which is not also the name of a shape, there will be no effect. But, if the shape name exists, then its color and border will change.
Clicking on one of the countries will reveal the name of the shape.
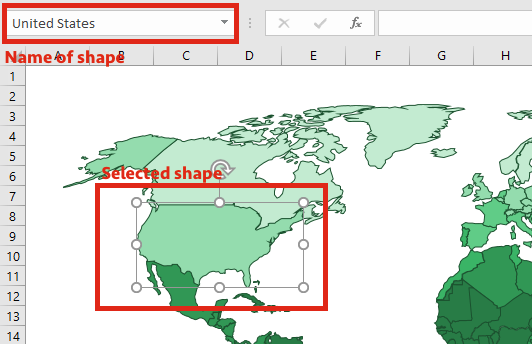
As some countries, such as Indonesia are constructed of multiple shapes, each shape is named “Indonesia”. Each shape does not need to have a unique name. Naming the shapes in this way ensures the formatting is applied to all shapes associated with that country.
Creating your own Map Chart
This section covers the steps to create your own Map Chart, which will work in exactly the same way as the World Map Template. The specific VBA code for each step is provided.
Overview
The basic steps are:
- Get a map with each country/region as a separate shape.
- List the names of all the shapes.
- Rename all the shapes to usable names.
- Get a final list all the shapes (with usable names) and the value related to each country/region.
- Define the colored banding for formatting each country/region.
- Use the ColorToShape User Defined Function to format the shapes.
Get a map in the right format
The easiest way to obtain new maps is to search the internet for maps embedded into PowerPoint files. You need to find maps where each country/region is a different shape. Simply copy the map (i.e all of the shapes) from PowerPoint into Excel. A good place to start is www.freeworldmaps.net, this is where I obtained the images for this post.
You could draw the shapes yourself straight into Excel, it would be quite time-consuming, but an option all the same.
List all the shape names
To get a list of all the shape names, select a cell and run the ListAllCountries Macro. This Macro will list the names of all the shapes on the active worksheet, starting with the selected cell.
Sub ListAllCountries()

Dim countryName As Shape
Dim i As Long

'Loop through each shape and list its name
For Each countryName In ActiveSheet.Shapes

    Selection.Offset(i, 0).Value = countryName.Name
     i = i + 1

Next countryName

End Sub
Rename the shapes
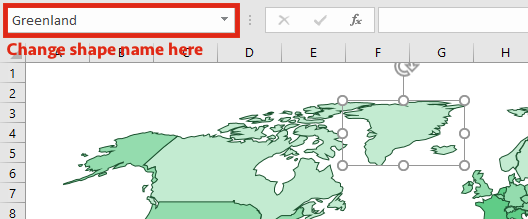
On most maps you get from the internet the names of the shapes are not particularly helpful, for example, the shape may be called “Freeform 102”, rather than “Australia”. In these circumstances, it is necessary to rename the shapes to something usable. This can be most painful and time-consuming part of the process.
The easiest way to rename a shape is to select the shape, change the name in the element name box then press Enter to confirm the change.
However, using this method, it is not possible to give multiple shapes the same name, which is fine for some circumstances but not others (such as the Indonesia example stated above).
Another option, is to rename the shapes using a User Defined Function which I created called NameCountries (see the code below). This function takes the following form:
=NameCountries(oldName, newName, targetSheetCell)
The NameCountries function takes 3 arguments;
- oldName = the current name of the shape – this can be a single cell reference or text string
- newName = the name you wish the shape to be called – this can be a single cell reference or a text string
- targetSheetCell = the reference to any cell on the sheet which contains the map
By using the NameCountires User Defined Function it is possible to give multiple shapes the same name.
The VBA code for the NameCountries function is here (Note – this code must be entered into a Module).
Public Function NameCountries(oldName As String, newName As String, _
targetSheetCell As Range)

Dim countryName As Shape
Dim targetSheetName As String

'Get the name of the sheet which contains the map
targetSheetName = targetSheetCell.Parent.Name

'Loop through each shape on the sheet which contains the map
For Each countryName In Sheets(targetSheetName).Shapes

    'Change the name from its existing name to a new name
    If oldName = countryName.Name Then

        countryName.Name = newName

    End If

Next countryName

End Function
List all the shape names . . . again (with the values)
Keep running the ListAllCountries Macro and the NameCountries function until you are happy with all the names.
Next, give each shape a value based on the data you wish to represent, (e.g. temperature, income, life expectancy, school grades, or whatever else you want to use the map for).
Create the colored banding and values
Next, create the ranges which will be applied to the countries. The fill color and left border color will be applied to each of the shapes.
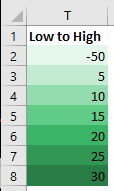
For the purposes of the ColorToShape User Defined Function (see below) it is necessary for the banding to go from smallest value at the top of the list to largest value at the bottom of the list.
The map shapes do not have a ‘default color’, they will only change when the forced to by the ColorToShape function (see below). To ensure the formatting is correct, the values for each country must be between the lowest and highest value in the colored banding range.
ColorToShape function
The Macros and User Defined Functions so far have been purely to set-up the map template in the right way. It is the ColorToShape function which drives the working template.
The ColorToShape function takes 4 arguments:
=ColorToShape(countryName, lookupValue, lookupRange, targetSheetCell)
- countryName = the name of the shape, can be a string or a single cell reference to a string.
- lookupValue = the value associated with the country/region/shape, can be a value or a single cell reference to a value.
- lookupRange = the range of cells containing the values and colored banding to be applied to the countries/regions/shapes.
- targetSheetCell = the reference to any cell on the sheet which contains the map
When this function is recalculated, it will change the color of the shapes based on the lookupValue and lookupRange.
The VBA code for the ColorToShape function is: (Note – this code must be entered into a Module):
Public Function ColorToShape(countryName As String, lookupValue As Double, _
lookupRange As Range, targetSheetCell as Range)

'Force recalculation
Application.Volatile

Dim countryShape As Shape
Dim lookupCell As Range
Dim targetSheetName As String

targetSheetName = targetSheetCell.Parent.Name

'Set default value of the function to "Not Found"
ColorToShape = "Not Found"

'Loop through each shape on the worksheet containing the map
For Each countryShape In Sheets(targetSheetName).Shapes

    'If the shape and countryName have the same name then
    If countryShape.Name = countryName Then

        'Loop through each cell in the colored banding range
        For Each lookupCell In lookupRange

            'If the value is less than or equal to the colored banding then
            If lookupCell.Value >= lookupValue Then

                'Apply the fill color of the colored banding
                countryShape.Fill.ForeColor.RGB = _
                RGB(Color2RGB(lookupCell.Interior.Color, "R"), _
                Color2RGB(lookupCell.Interior.Color, "G"), _
                Color2RGB(lookupCell.Interior.Color, "B"))

                'Apply the left border of the colored banding
                countryShape.Line.ForeColor.RGB = _
                RGB(Color2RGB(lookupCell.Borders(xlEdgeLeft).Color, "R"), _
                Color2RGB(lookupCell.Borders(xlEdgeLeft).Color, "G"), _
                Color2RGB(lookupCell.Borders(xlEdgeLeft).Color, "B"))

                'Change the result of the UDF to "Formatted"
                ColorToShape = "Formatted"

                'Formatting applied, stop looping through
                Exit For

            End If

        Next lookupCell

    End If

Next countryShape

End Function
The ColorToShape function calls another function to obtain the correct RGB color reference. Include the following code within the same Module as the ColorToShape function.
Private Function Color2RGB(Color As Long, ColorSelect As String) As Long
Dim Red As Long
Dim Green As Long
Dim Blue As Long

Red = Color Mod 256
Green = Color \ 256 Mod 256
Blue = Color \ 65536 Mod 256

Select Case ColorSelect

    Case "R"
        Color2RGB = Red
    Case "G"
        Color2RGB = Green
    Case "B"
        Color2RGB = Blue

End Select

End Function
Conclusion
Hopefully you can see the subtle message that Excel is not a good Business Intelligence tool is flawed. A bit of Excel/VBA trickery is all that is required to turn Excel into a tool which can create Map Charts. The expensive BI tools will be much easier to set-up, but will be limited in their options. Using this method, Excel can be turned into anything you wish, for example, if you want a map of Middle Earth from the Lord of the Rings, it can be achieved with Excel.
Discover how you can automate your work with our Excel courses and tools.
The Excel Academy

Make working late a thing of the past.
The Excel Academy is Excel training for professionals who want to save time.
Mark, This would be great for little games. 🙂
Thanks for the write-up. It ill cut down that learning curve considerably!
Cheers,
Mitch
Hi Mitch – I hadn’t thought of games as a possible usage, that’s a good idea.
Hi, please verify link of download of world map, not working for me.
Hi Flavio – I’ve just tried it and it’s working for me. But I will e-mail you a copy directly.
I tried to add some more color band cells but they do not seem to work. I added a few more below the 30 value cell and added the values of 35. 40, 45 etc. Changing the value of a country to a new value above 30 shows up the UDF column as “Not Found”. How do I add more value color cells?
Hi Darren,
There are two options here:
(1) Insert new color cells into the existing color cells (i.e. don’t add to the bottom, but add into the middle). This will expand the formula range automatically.
(2) Add the color cells to the bottom as you have already. The formula in Column S refers to the range $T$2:$T:$10, expand this range to incorporate the new cells added to the bottom.
Let me know how you get on.
I want to create my own map, with countries I’ll draw.
Is it correct the images should be vector files?
Hi,
The pictures must be editable as shapes, so they will need to be vector images which Excel will render. I’m not sure which vector images are compatible with Excel, so it would be worth testing one shape first just to make sure.
There are a number of sites which provide maps for free or at a small price. It might be worth looking into those to save some time.
Hi, I would like to get the name of a active shape in a cell.
For example: I click on the shape “Austrialia” and in Cell A1 stands “Australia”
.Do you have an idea how to do this?
Besides that, thank you very much for providing this awesome template 🙂
That’s a good question.
Normally, we would use Worksheet Events for these types of action, however there are no events for selection of objects.
But we can use an easier option.
(1) Create a macro in a standard module as follows:
Sub ShowSelectionName()

Sheets("World Map").Range("A1").Value = Application.Caller

End Sub
(2) Right-click on the shape and Assign the Macro created in step 1 above.
If you’re thinking “What, I’ve got to assign the macro to each shape! That will take way too long”, you could try the following macro to assign the macro to every shape on the worksheet.
Sub ApplyMacroToAllShapes() Dim shp As Shape Dim ws As Worksheet Set ws = ActiveSheet For Each shp In ws.Shapes shp.OnAction = "'" & ActiveWorkbook.Name & "'!ShowSelectionName" Next shp End SubHey Mark your guide was INCREDIBLY helpful for a task I received, I have to thank you an infinite number of times.
Plus it is very clear, simple and understandable, your code is so clean.
Just wanted to leave a thanks, you’re amazing keep it up!
Thanks Karl – that’s very kind of you to say 😊