
“Not again…” I think to myself every time I change the minimum and maximum values of a chart axis. It’s such a tedious task, and I know I’ll be doing it again at a future point. It only takes a few seconds, but all that time starts to add up. There are various chart objects we can link to worksheet cells; source data, chart titles and data labels can all be linked to cells, but the chart axis is set by hardcoding a number into the Format Axis options window. What we really want is to set chart axis based on a cell value.
Well… I’m not so easily defeated. I decided to build a more dynamic solution. I turned to my old friend VBA, and started to tinker. Below you’ll find the result of that tinkering; a formula which exists on the worksheet to control the min and max values of a chart axis. Link that formula to a cell and suddenly it is possible to set the chart axis based on a cell value.
Hopefully, by the end of this post, you too can share in the automatic cell linked bliss I now experience.
If you’re not familiar with VBA, don’t worry, I’ll talk you through it step-by-step.
Download the example file: Join the free Insiders Program and gain access to the example file used for this post.
File name: 0170 Chart Min Max based on cell value.xlsm
The solution
I wanted a solution which:
- Updates automatically whenever data changes
- Does not require user interaction – i.e. no button clicking, but updates automatically when the worksheet recalculates
- Easily portable between different worksheets
I think I managed to achieve this.
User Defined Functions (UDFs for short) are just like normal Excel functions, such as VLOOKUP or SUM, but they have been created using VBA. UDF’s are intended to be custom worksheet functions to calculate a cell value. Whether on purpose or by accident, Microsoft have made it possible to control various objects with UDFs. For example, it is possible to change a worksheet’s tab color, or to change a chart title (next week’s post). Thankfully, the minimum and maximum values of the chart axis are controllable using a UDF. Horray!
The solution in action
The animated gif below shows the solution in action. The values in the cell are automatically applied to the chart. Whether these values are typed in the cell or created using formulas, they will update the chart.
User Defined Function to set axis based on a cell value
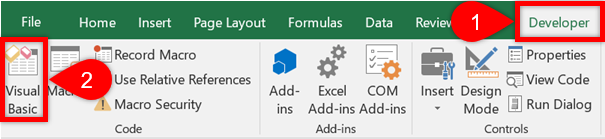
To create the UDF click Developer -> Visual Basic (or shortcut ALT + F11).
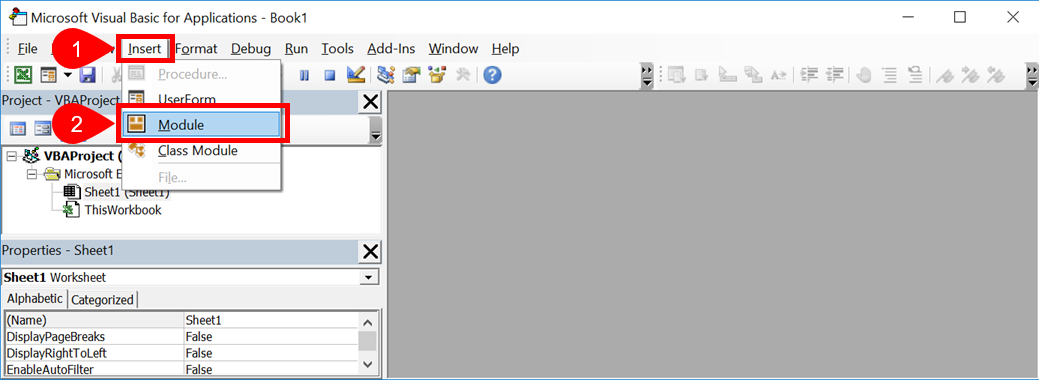
The Visual Basic Editor window will open, click Insert -> Module
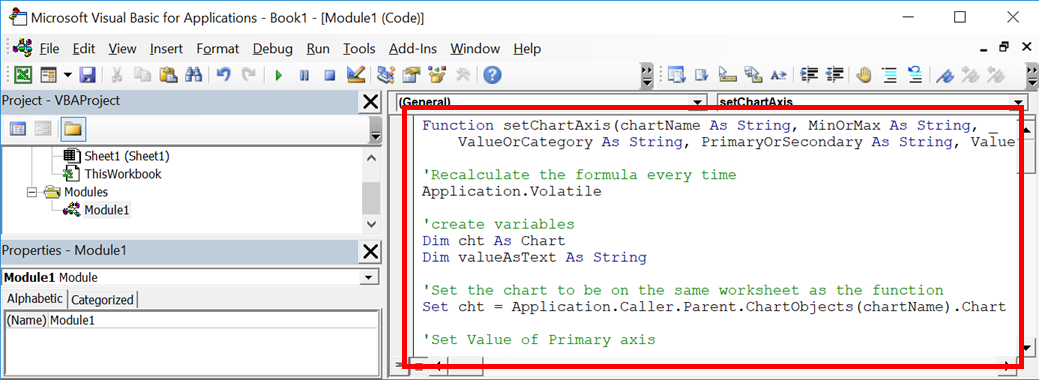
Add the code below to the Module as shown. The code for UDFs must be within a standard module to work.
The VBA Code
Here is the VBA code to copy into the Module.
Function setChartAxis(sheetName As String, chartName As String, MinOrMax As String, _
    ValueOrCategory As String, PrimaryOrSecondary As String, Value As Variant)

'Create variables
Dim cht As Chart
Dim valueAsText As String

'Set the chart to be controlled by the function
Set cht = Application.Caller.Parent.Parent.Sheets(sheetName) _
    .ChartObjects(chartName).Chart

'Set Value of Primary axis
If (ValueOrCategory = "Value" Or ValueOrCategory = "Y") _
    And PrimaryOrSecondary = "Primary" Then

    With cht.Axes(xlValue, xlPrimary)
        If IsNumeric(Value) = True Then
            If MinOrMax = "Max" Then .MaximumScale = Value
            If MinOrMax = "Min" Then .MinimumScale = Value
        Else
            If MinOrMax = "Max" Then .MaximumScaleIsAuto = True
            If MinOrMax = "Min" Then .MinimumScaleIsAuto = True
        End If
    End With
End If

'Set Category of Primary axis
If (ValueOrCategory = "Category" Or ValueOrCategory = "X") _
    And PrimaryOrSecondary = "Primary" Then

    With cht.Axes(xlCategory, xlPrimary)
        If IsNumeric(Value) = True Then
            If MinOrMax = "Max" Then .MaximumScale = Value
            If MinOrMax = "Min" Then .MinimumScale = Value
        Else
            If MinOrMax = "Max" Then .MaximumScaleIsAuto = True
            If MinOrMax = "Min" Then .MinimumScaleIsAuto = True
        End If
    End With
End If

'Set value of secondary axis
If (ValueOrCategory = "Value" Or ValueOrCategory = "Y") _
    And PrimaryOrSecondary = "Secondary" Then

    With cht.Axes(xlValue, xlSecondary)
        If IsNumeric(Value) = True Then
            If MinOrMax = "Max" Then .MaximumScale = Value
            If MinOrMax = "Min" Then .MinimumScale = Value
        Else
            If MinOrMax = "Max" Then .MaximumScaleIsAuto = True
            If MinOrMax = "Min" Then .MinimumScaleIsAuto = True
        End If
    End With
End If

'Set category of secondary axis
If (ValueOrCategory = "Category" Or ValueOrCategory = "X") _
    And PrimaryOrSecondary = "Secondary" Then
    With cht.Axes(xlCategory, xlSecondary)
        If IsNumeric(Value) = True Then
            If MinOrMax = "Max" Then .MaximumScale = Value
            If MinOrMax = "Min" Then .MinimumScale = Value
        Else
            If MinOrMax = "Max" Then .MaximumScaleIsAuto = True
            If MinOrMax = "Min" Then .MinimumScaleIsAuto = True
        End If
    End With
End If

'If is text always display "Auto"
If IsNumeric(Value) Then valueAsText = Value Else valueAsText = "Auto"

'Output a text string to indicate the value
setChartAxis = ValueOrCategory & " " & PrimaryOrSecondary & " " _
    & MinOrMax & ": " & valueAsText

End Function
That’s all we need to do to create the UDF, now it’s ready to use.
Using the function
The function we have created uses the following syntax:
=setChartAxis(sheetName, chartName, MinOrMax, ValueOrCategory, PrimaryOrSecondary, Value)
- sheetName = the name of the worksheet which contains the chart.
- chartName = the name of the chart as a text string, or a cell reference to a text string. If you’re not sure of a chart’s name, click on the chart and look at the NameBox (the box to the left of the formula bar).
- MinOrMax = a text string of “Min” or “Max” to select whether the function will control the Minimum or Maximum axis value.
- ValueOrCategory = a text string of “Value” or “Category” to indicate which axis to adjust (will also accept “X” or “Y”)
- PrimaryOrSecondary = a text string of “Primary” or “Secondary” to indicate which axis to adjust.
- Value = a number, or a text string. A number will adjust the axis to that value, “Auto” will reset the axis to Automatic.
For the function the work, the chart must be in the same workbook as the function.
Unlike normal functions, UDF’s do not display the order of the arguments when typed into the formula bar. Therefore, the best options are:
- Start typing the UDF then press Ctrl + Shift + A after typing the first bracket, the arguments will appear.

- Click on the fx button in the formula bar. In the Insert Function window select the function under the User Defined list, then click OK.
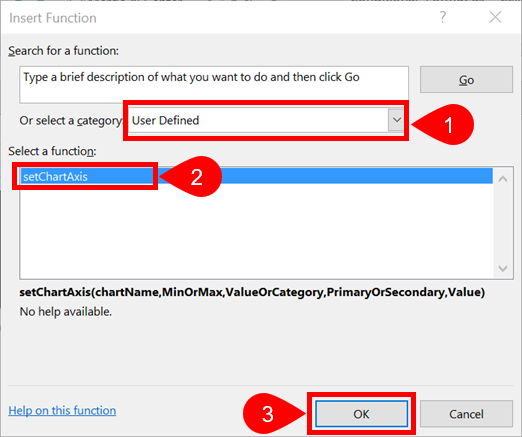
The Function Arguments window will show the order and names of the arguments.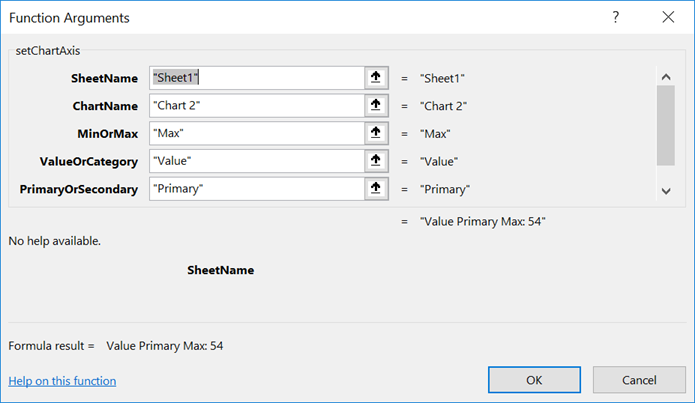
The screenshot below shows how the UDF is used:
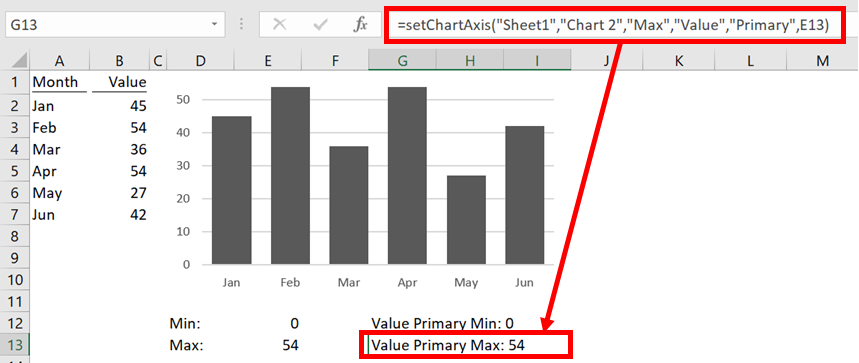
The formula in Cell G12 is:
=setChartAxis("Sheet1","Chart 2","Min","Value","Primary",E12)
Resetting back to default axis
If you decide to revert back to Excel’s automatic axis calculation, that is no problem. Any non-numeric value entered as the Value (or in the cell reference linked to the value) will cause the chart to be reset to automatic.
=setChartAxis("Sheet1","Chart 2","Min","Value","Primary","Auto")
Making the function available in all workbooks
If you wish to make the UDF available in all your workbooks:
- Include the code above within a new workbook
- Save the workbook as an Excel Add-in (.xlam file type).
- Install the Add-in you have created by following these instructions.
The function is now available in all your workbooks. If others open the workbook they will be able to see the function, but it will not work. If you want other users to use the function save it in each individual file.
Related Posts:
- How to change images based on cell values
- Create dynamic chart titles with custom formatting
- Dynamic arrays and VBA user defined functions (UDFs)
Discover how you can automate your work with our Excel courses and tools.
The Excel Academy

Make working late a thing of the past.
The Excel Academy is Excel training for professionals who want to save time.
Hi,
When I try the formula with “Secondary” for PrimaryOrSecondary, I’m getting a #VALUE error.
Hi Divya,
The #VALUE! error occurs if there is any error at all, so it could be any number of things.
The most likely reason is that the chart doesn’t have series with a secondary axis.
Hey Mark — I love this trick.
I am trying to put my chart into a powerpoint and link it to the sheet.
When I am changing the axis in the sheet it doesnt also link to the chart in powerpoint. How would I get it to do that?
I’ve you’ve pasted as a chart object into PowerPoint, it will be an independent object. It will share the data, but nothing else.
If you paste as a linked range object it will create a link as picture of the original chart which will update.
Hi Mark,
Thanks for your reply.
It didn’t work when I tried it in the Excel spreadsheet that you have attached as well.
I may be missing something, I’m not sure what.
Hi Divya,
I’ll send you the file with the Secondary Axis set-up so you can see how it works.
Hi!
Thank you for this, it has really helped me!
I’m experiencing this problem as well. Would you mind sending me this file too?
Hi Mark,
Thank you for this!
I am experiencing the same issues as Divya. Could you possibly forward the file mentioned above to me as well?
Thanks.
Hi Mitra,
I have updated the file in the post to show how to use all axis. So if you download the file (see the link in the post) you should be able to see how it works.
I am also experiencing the Value error problem with both primary and secondary axis. Could you help
Have you tried downloading the example file and comparing to see where yours is different? There is a link to the download toward the bottom of the post.
Dear All,
I got the same error.
Using the fx for help by filling in, it looks that the syntax is a little different.
You should not use:
=setChartAxis(chartName, MinOrMax, ValueOrCategory, PrimaryOrSecondary, Value)
but
=setChartAxis(sheetname,chartName, MinOrMax, ValueOrCategory, PrimaryOrSecondary, Value)
Hi there,
this is a super cool function! Many thanks for setting it up and sharing it… Once you see the code it does not even look that complicated (when it is already there 😉 ). I was wondering if the script could be adapted to also change the units of the graph (stepsize). Any idea what name should be used to refer to the attribute of the major units ?
Many thanks anyhow, this really helps me.
Kind regards,
Benno
Hi Benno,
Yes, easy enough to add the units. Add the following code above the line of code which says: ‘If is text always display “Auto”
'Set Value of Unit Primary Axis
If ValueOrCategory = "Unit" And PrimaryOrSecondary = "Primary" Then

    With cht.Axes(xlValue, xlPrimary)
        If IsNumeric(Value) = True Then
            If MinOrMax = "Major" Then .MajorUnit = Value
            If MinOrMax = "Minor" Then .MinorUnit = Value
        Else
            If MinOrMax = "Major" Then .MajorUnitIsAuto = True
            If MinOrMax = "Minor" Then .MinorUnitIsAuto = True
        End If
    End With
End If


'Set Value of Unit Secondary Axis
If ValueOrCategory = "Unit" And PrimaryOrSecondary = "Secondary" Then

    With cht.Axes(xlValue, xlSecondary)
        If IsNumeric(Value) = True Then
            If MinOrMax = "Major" Then .MajorUnit = Value
            If MinOrMax = "Minor" Then .MinorUnit = Value
        Else
            If MinOrMax = "Major" Then .MajorUnitIsAuto = True
            If MinOrMax = "Minor" Then .MinorUnitIsAuto = True
        End If
    End With
End If
Then to refer to it in the formula, use “Unit” instead of “Value” and use either “Major” or “Minor” instead of “Min” or “Max”.
Hopefully that’s enough for you to get it working.
Thanks Mark,
This is really appreciated!
Cheers,
Benno
Nice, this worsk fine!
How can I add units in the x-axis as well?
Hi Martin – Look at the other comments above, the answer is included in there already.
Hi again, thanks for answering.
I’m sorry, but I can’t find the comment you are reffering to. If I understand this additional code correctly, you can add units to the primary or secondary Y-axis by writing:
=setChartAxis(sheetName, chartName, “Major”, “Unit”, “Primary”, Value)
or
=setChartAxis(sheetName, chartName, “Major”, “Unit”, “Secondary”, Value)
But how do I change to the X-axis now that the ValueOrCategory = “Unit”?
After much trial and error I found that the code was slightly incorrect for the X-Axis. Should be as below:
‘Set Value of Unit Primary Axis
If ValueOrCategory = “Unit” And PrimaryOrSecondary = “Primary” Then
With cht.Axes(xlValue, xlPrimary)
If IsNumeric(Value) = True Then
If MinOrMax = “Major” Then .MajorUnit = Value
If MinOrMax = “Minor” Then .MinorUnit = Value
Else
If MinOrMax = “Major” Then .MajorUnitIsAuto = True
If MinOrMax = “Minor” Then .MinorUnitIsAuto = True
End If
End With
End If
‘Set Value of Unit Secondary Axis
If ValueOrCategory = “Unit” And PrimaryOrSecondary = “Secondary” Then
With cht.Axes(xlCategory, xlPrimary)
If IsNumeric(Value) = True Then
If MinOrMax = “Major” Then .MajorUnit = Value
If MinOrMax = “Minor” Then .MinorUnit = Value
Else
If MinOrMax = “Major” Then .MajorUnitIsAuto = True
If MinOrMax = “Minor” Then .MinorUnitIsAuto = True
End If
End With
End If
Hello!
This is amazing stuff! thank you so much.
I was wondering if you could also make the X axis based on min and max. In your example you have Jan, Feb etc but what if the months were numbers 1 for Jan, 2 for Feb etc (this is my case) and then you want to plot only from Feb to June.
Let me know if that is possible. Thanks again!
Hi Diego,
Yes this is possible.
(1) Right click on the X Axis and click Format Axis… from the menu.
(2) From the Axis Options select the Data axis option box
(3) In the formula set the ValueOrCategory argument to be “Category”.
If the axis labels are text, Excel will assume the first data point will be 1, the second data point will be 2 and so on. So you can still use month names, rather than month numbers.
Hello. Thank you so much for your quick response. The Y axis works perfectly but it seems like the function does not work on the X axis, I keep getting a #VALUE error.
My graph has 3 sets of data represented with a line and stacked bars. Could that be the problem?
It definiely works. I’ll send you a file with it working.
You might have been confused by the typo in my last comment. It needs to be a “Date axis”.
Thank you Mark!
Hi,
great code works perfect if I don’t protect sheets but I would like to protect all sheet is there any work around for this please?
Hi Paul,
I’m not aware of any workarounds. I wish there was one too. 🙁
Thanks anyway. 🙁
This worked beautifully for me. Can I piggyback on this code and make a straight horizontal line at a defined value? Using the series method seems to interrupt the code and caused other issues for me.
Hi Chris,
I would have thought that having a separate chart series would be your best option. As chart values can already be linked to cells, it would be straight forward to update dynamically.
I can get the line to work and the vba code to work but separately. When I use together the graph displays only one date and no graph on the x axis. The Y axis still functions normally. I looked into the axis information and it now has a bound function that does not work with current coding. How can I adjust bound using vba?
Never mind! I figured it out, there was a data range I had changed and that caused another formula feeding into the UDF to go haywire. Thank you for your assistance
I’m glad you got it working. Apologies for the late response, I had some time off over the holidays.
This function is great. I have a scatter plot with an X and a Y axis. How would I change the code to work on the X-axis as well?
In the Category argument of the function use “X” or “Y” for a scatter plot.
For example:
=setChartAxis(“Sheet1″,”Chart 1″,”Max”,”X”,”Primary”,B5)
Hey,
The script worked and works perfectly. I am not an Excel guru so I have no idea why but for some reason Excel crashes if you sort a table in a document where your module/code is present. I tested it on 3 separated PC’s with my documents and the example you provide here, tested with Excel 2016 and 2019. It worked one month ago (if it helps)…
Steps to reproduce:
– the example document you provide on this page
– enter some random data, select it and “format as table”
– sort the new created table
Result: excel crashes. It does not crash anymore when you delete the module from the file.
Thanks for the awesome script/code/module. 🙂
Hey Daniel,
That’s really useful testing, thank you for letting me know.
I think I’ve been able to identify the problem.
The code uses “Application.Volatile”, which forces the formula to recalculate everytime there is a change in the workbook. It’s there to avoid some specific unlikely events.
Obviously, crashing when it sorts is bad, especially as sorting and not an unlikely event. So I recommend removing that line of code (which I will also do in my example file).
Hi I hope you’re still monitoring this.
First, this function absolutely rocks! I use it in an AR report where the regional directors can switch from company view of AR down to their own portfolio in a flash. So thank you for sharing the code.
The problem I’m having is just like Daniel above. If I sort within the workbook excel crashes every time. Even copying down can sometimes freeze excel for minutes. “Application.volatile” is not in the version of code I’m using. As you mentioned, protection and udfs don’t play nice together, either. In updating the report I have to do my sorting in a new workbook then copy back into the report. Since it’s a report that goes out to multiple others in my company on a regular basis I may have to figure out a different tool but this one is so perfect for our needs.
This is an experimental technique which is not supported by Microsoft.
This was never intended to get to #1 in Google search.
The alternative and more accepted method is to use Events in VBA to trigger the macro. That might meet you scenario better.
Hey,
Thank you so much for this, it works perfectly on my copy.
I have uploaded it to a shared drive and when someone else opens it they get ERROR in the box.
When I troubleshooted this, I found that if I double-clicked to open the text-box and then enter out it seems to refresh and the error goes away.
The box contains the formula:
=setChartAxis(“Chart”,”Weight Chart”,”Min”,”Value”,”Primary”,B1)
Each person has to re-enable the macros each time it’s opened but this doesn’t seem to change the error.
Do you know a fix for this?
Hi Edward,
Are the charts and the code in the same workbooks? If so I’m not sure why it would be causing problems.
This isn’t exactly a Microsoft supported solution, so there are lots of aspects which we’re still learning about.
They were in the same sheet but I had hidden them behind the chart.
I’ve now moved the formula to just below and made the text white and it seems to work fine.
No idea why that’s made a difference but i haven’t had that fault since!
Hi Edward,
Thanks for sharing your workaround. I have no idea why it would make any difference, but it’s working and that’s the main thing 🙂
Hi,
When I try this with two different charts across 2 worksheets it only works for one, the other remains as Auto
Can you advise?
Thanks
Hi Dave,
Please can you send the file to me, then I can investigate the issue.
The issue is mixing up the Value and Category axis. On the 2nd sheet you need to use “Category” in place of “Value”.
Hi Mark,
I am trying to use this on a line chart. I have 3 sets of data that are decreasing at a different rate over time. My Y axis is a value in hours remaining. My X Axis is a date range.
I am able to use the formula to control the Y axis to be set between min 0 and Max based on the maximum stating value compared to my three sets.
When I try to use it to change the X axis between my start date and my end date i either get #value! or it makes my x axis disappear in my chart. what do you think?
Hi John,
My guess is that the date axis or the value is text formatted.
Have you set the X axis as a Date Axis in the Axis Options?
Hello,
I am having the same issue as John, however, I have set the X axis to Date Axis and have confirmed that the dates I am feeding in are numeric dates (eg. if I perform the operation on the cell “cell + 1” it works: I get a date that is one day after as a result). Any other suggestions?
Thanks,
Steph
Hi Steph,
In the comments below Cat suggest changing each instance of
to
I have not had chance to update the post or download file for this yet.
Hi! This code is displaying the “Value primary max” cell correctly, but it does nothing to edit my chart. any ideas?
Maybe if I could see the file, I might be able to help.
Did anyone figure this out? Because I am having a similar issue.
Did you download the sample file to compare it to what you’ve done?
Hi this is great code – however one thing i’ve noticed is that in automatic calculation, the undo function becomes unavailable. I suspect because the function is constantly calculating?
Unfortunately, any time VBA code is run in Excel it clears the undo stack. It will also have the same effect when user defined functions are recalculated.
It’s just the way Excel is built.
Very helpful formula! Question, how would the formula differ for a chart with both a Primary Y axis and Secondary Y axis?
Thanks in advance!
Hi Brandon – You would have a formula for each axis. Something like this:
=setChartAxis("Sheet1","Chart 2","Max","Y","Primary",E12) =setChartAxis("Sheet1","Chart 2","Max","Y","Secondary",E13)I can’t seem to get this UDF to work without a #VALUE! error when the chart is a standalone. When the chart is moved to a created sheet1 for example, I can then name the chart and it works appropriately. When the chart is moved to a standalone sheet, the formula no longer works.
Hi John – To use with a Chart Sheet, you’ll just need to change a few sections of the code:
Define the function like this:
Function setChartAxis(sheetName As String, MinOrMax As String, _
    ValueOrCategory As String, PrimaryOrSecondary As String, Value As Variant)
Change the Set cht line as follows:
Remove the Chart name when you call the function. So it will be something like this:
=setChartAxis("Chart1","Max","Value","Primary",C7)Hello,
I have this code partially working. but it keeps displaying me “Category primary Min: Auto”, instead of the cell which I am referencing it. I am trying to modify the X-axis with dates of start and end period. any idea what is the problem?
Hi Julio – My best guess is that the dates are formatted as text, rather than as numbers/dates.
The existing code doesn’t work with dates because they are not numeric. The code uses IsNumeric(Value) to determine whether to use your value or not, if it is false then it uses the auto scaling, and dates return false.
I just replaced IsNumeric(Value) with (IsNumeric(Value) Or IsDate(Value)) throughout the code and it worked, e.g:
‘Set Value of Primary axis
If (ValueOrCategory = “Value” Or ValueOrCategory = “Y”) _
And PrimaryOrSecondary = “Primary” Then
With cht.Axes(xlValue, xlPrimary)
If (IsNumeric(Value) Or IsDate(Value)) = True Then
If MinOrMax = “Max” Then .MaximumScale = Value
If MinOrMax = “Min” Then .MinimumScale = Value
Else
If MinOrMax = “Max” Then .MaximumScaleIsAuto = True
If MinOrMax = “Min” Then .MinimumScaleIsAuto = True
End If
End With
End If
Many thanks for this Cat!! I thought I was going mad trying to solve this!
Great function and for sharing it! I have a strange thing. The function works like a charm when I set it up. When I save (as xlsm) and reopen the formula switches to a #NAME! error whenever I change ANYTHING at all in the sheet. Would you know what this could be? I sort of defies the function of having an automatically updating chart :\
Just to help anybody who is reading this and experiencing the same problem. The issue was caused by macro security settings being set too high, therefore the VBA code was not being executed.
I had the same problem that the formula results in #NAME!.
I fixed the problem by changing the assignment of the “cht” variable
I changed:
Set cht = Application.Caller.Parent.Parent.Sheets(sheetName) _
.ChartObjects(chartName).Chart
into
Set cht = Sheets(sheetName).ChartObjects(chartName).Chart
Now the function work fine.
thanks!
Using the change you suggested prevented a crashing problem I was having when trying to Filter and Sort
Hello,
I saw that as of November there was no work around for protecting sheets.. I am wondering if you have come across it between then and now?
Sorry, I’ve not found a workaround.
Great code. But It seems that I am not doing something right as it isn’t changing the axis bounds. Any help ?
Why now download the example file, to see how to apply it correctly.
Hi
Is there any way to get this to work with charts in their own ‘sheet’? Ie chart is in its own tab, not on the same sheet as the function. It doesn’t seem to have a worksheet name at all.
Cheers
Tim
Hi Tim – Thanks for the question. Check out the comments above, as I think this has already been asked.
Thanks for your excellent tips and advice.
I took a shot at enhancing this VBA to allow adjustment of both the x-axis and y-axis units(grid spacing), but messed up and now have both x and y units(grid spacings) changing together.
I also was trying to get the Vertical and Horizontal axis crossing values to change using .CrossesAt. I can get some functionality, but not very consistently. I have no VBA experience and tried to reverse engineer your VBA to some degree but my lack of coding experience limits what I can do. Could you show us how to add these enhancements? It would be very convenient to get the axis crossovers to also change automatically along with the automatically re-scaled y/x max/min limits. Most plots I generate need the axis crossings at the lower left corner of the plot. Thanks very much for your service.
Hi John – Thanks for the question. Please check out the comments above, as a similar question has already been asked about Gridlines by Benno on 29 November 2018.
In regard to getting the axis to cross, what chart type are you using? Can you send me an example file.
Wonderful functionality! Great work, thank you 🙂
No problem, glad it helped 🙂
Hi,
Great function. It works great but … It does something odd to my data. It shows my values way outside the chart. It’s way above the range it’s supposed to be. Any suggestions ?
Hi again,
I found the problem. It was linked to another worksheet and showing me the wrong rows. Sorry to bother you.
Hello,
Its a great code you have here and it works perfectly, thank you, but I am now using it in a program i have made as part of my thesis. When i sent this program for review to my professor it didnt work he reported.
I have seen above that protected sheets might cause this problem, and yes it was in fact protected when i sent it. My question however is, if i send it to him again, without protection, will he be able to use the macro like I do or must he add the module himself?
Thanks in advance
Christian
Hi Christian – It depends where the code is located.
If the code is within a Module within the same Excel file as the graphs then it should work on another PC. If the code is within you Personal Macrobook (or somewhere similar), then it will not work on another PC, they will have to set-up the same formula.
Wonderful code. Could you please share some of the syntax required to re-purpose your code for things like reversing the values on an an axis? Or any of the many other modifiable attributes of axes? Thanks.
Excel Charts have a huge Document Object Model, so it would take a long time to list all the options. I have another post about VBA code for charts, which can be found here: https://exceloffthegrid.com/vba-code-for-charts-and-graphs-in-excel/
The macro recorder is always a reasonable option to find the end of the code. Taking your specific example, about reversing the order, the code would be
Thank you for this awesome code, it works perfectly!
Two question that I have:
1.) Why does it limit the workbook’s Undo possibilities to just 1 step (Tested, and after the module is created with the code in a new workbook, I can no longer undo more than 1 step).
2.) Could anyone please adjust the code or tell me why it limits the Undos?
Thank you very much,
Artur
Unfortunately, any time VBA code is run in Excel it clears the undo stack.
We would all like an Undo feature for macros, but it’s just the way Excel is built.
Hi,
Thank you. For some reason, all I get is #VALUE!. I already downloaded your file and it looks exactly like mine.
My chart has two primary Axis and one secondary. I am trying to set the max value on the secondary axis. i would greatly appreciate if you can please help out.
Please Disregard my previous post. All I was missing was a space in the chart name.
It works wonderfully!
Thank you so much!
Hi,
Here I am again.
I have the min set to 0 and the max is based on the value of a specific cell. The issue is that if for example the max value is 87,500, the highest axis number on the chart will be 80,000 because it goes by 10 or 20 etc. increments. Is there a way to have the lowest axis number 0 and the highest based on the value (in this example 87,500) and all in between should be equally divided between 0 and 87,500
Look at some of the comments above, which detail how to adapt the macro to set the major and minimum unit. You’ll need the Major Unit to be 87,500, then the Minor Unit to be the units in between.
Thank you for this great formula, I am getting the #Name error are you able to help me
The most likely causes of #NAME errors are:
(1) Typo in the formula name
(2) Missing double quotes around a text value
(3) Trying to use a named range which doesn’t exist
Thanks for the great code and the great support and explanations!
Wish I had such a great understanding of Excel and VBA.
Thanks Greg – I’m glad I could help.
Hi EOFG,
Thanks for sharing the code, it works well and is the first time I’ve come across User Defined Functions.
I’m trying to update my workbook so that your function refences the current sheet name and chart name, so that it will continue to work if a sheet is copied.
So far, I’ve used the function “=MID(CELL(“filename”,A1),FIND(“]”,CELL(“filename”,A1))+1,255)” in a cell to give the sheet name, and am then pointing your function at the cell. By not hard-coding the tab name it means that the function continues to work if the tab name is changed.
I was hoping to do the same with the chartname. I can see the new chart name in the name box when selected, but couldn’t find a way to extract this info into a cell using a function.
Did you have any pointers?
Cheers NM
In it would be possible to write a UDF to get the chart name into a cell, but I’m not sure this is necessary. Using the name box, you can rename a chart. It may say “Chart 1” in the name box, but you can overtype this and press enter. This will fix the chart name to whatever you need it to be.
Thanks for the pointer, I’ll give that a go.
You have explained your chart axis vba perfectly.
Your code is a real time saver. I simply wanted to thank you for providing the code and saving me mental ordeals.
Thanks again.
Greatings from Brazil! thanks , function very useful
Thanks Davi 🙂
Would anybody know the code for crossesAt a certain number?
I found this on the internet, tried to write my own code but it didn’t work.
https://docs.microsoft.com/en-us/office/vba/api/excel.crossesat
My code:
Function setChartCross(sheetName As String, chartName As String, Axis As String, Number As Variant)
‘create variables
Dim chrt As Chart
‘Set the chart to be on the same worksheet as the function
‘Set cht = Application.Caller.Parent.ChartObjects(chartName).Chart
Set chrt = Application.Caller.Parent.Parent.Sheets(sheetName) _
.ChartObjects(chartName).Chart
‘Set Value of Primary axis
If (Axis = “Axis”) Then
With chrt.Axes(xlCategory).Crosses = Number
If IsNumeric(Number) = True Then
If Axis = “Axis” Then .Axes(xlCategory).Crosses = Number
Else
If Axis = “Axis” Then .Axes(xlCategory).Crosses = 0
End If
End With
End If
End Function
Would be lovely if you could help
I think this gives you want you need:
Function setChartCross(sheetName As String, chartName As String, Number As Variant) 'create variables Dim cht As Chart 'Set the chart to be on the same worksheet as the functiont Set cht = Application.Caller.Parent.Parent.Sheets(sheetName).ChartObjects(chartName).Chart 'Set Value of Primary axis If IsNumeric(Number) = True Then cht.Axes(xlCategory).CrossesAt = Number Else cht.Axes(xlCategory).CrossesAt = 0 End If setChartCross = "Crosses at:" & Number End FunctionThank you for this code, I enjoyed your clear explanations and the codes usefulness.
I experienced a problem:
When I had a workbook open that was using this VBA code, if I opened up a csv file with data, added a Filter, then tried to Sort, all open workbooks would crash. I repeated this multiple times to be sure it was the VBA code.
I then found this comment from another user, and making the change fixed the crashing issue:
Pevernagie says:
I had the same problem that the formula results in #NAME!.
I fixed the problem by changing the assignment of the “cht” variable
I changed:
Set cht = Application.Caller.Parent.Parent.Sheets(sheetName) _
.ChartObjects(chartName).Chart
into
Set cht = Sheets(sheetName).ChartObjects(chartName).Chart
Now the function work fine.
I am trying to use this code and it is almost working for me. I can get the primary values to work and even my secondary values and categories to work. However, I’m having issues with the primary category.
I have my chart set up displaying years and quarters. So along the primary axis, it reads, 1 Q1, 1 Q2, 1 Q3, etc. The values behind the labels are set by a month number, 1-120, which then displays as 10 Q4.
What do I have to set my primary category to in order to line up with this format? I cannot get the function to show other than #value!
Other than that, great function!
Hi Tim
1 Q1, 1 Q2, 1 Q3 etc would be a text string, so Excel will default to a Text axis. You’ll need to purposefully change the axis to a Date axis.
This will allow position numbers to be used within the formula.
Thank you very much for this code and the explanations given. It has made a great difference to my report.
Great news, thanks Mitch.
Today, you saved my life! thkx
Thanks Felipe – I’m glad to help.
Hi, this code worked fantastic for me for a few days. Now my workbook opens with an error – cant find object or library. I cannot view the module anymore. When i try and save the workbook it says its damaged.
Hi Jon – thanks for sharing this. I’d be surprised if it’s the UDF causing this type of behavior. Has anybody else had this type of issue?
This is some awesome stuff and it really helps to save so much time!
However, it seems to cause my radio buttons on the other sheet to crash saying that “There isn’t enough memory to complete this action. Try using less data or closing other applications. To increase memory availability, consider using a 64-bit version of Microsoft Excel.”. May I know if you have met this issue before and do you have any solutions? Thank you very much!
I’ve not come across it before. Are you able to send the workbook to me to have a look?
Love it thank you. It fixed a problem that I was having with scale on a FTE report that I have been having.
Really, really appreciated.
Thank you so much for your work, much appreciated.
Is it possible this VBA work for multiple charts in the same sheet also in the same workbook?
Yes. Repeat the formula, then change the chart name in the second argument.
Thank you. Much appreciated.
I cannot seem to get this to work on my simple line graph. It looks like it is all in there and looked at your set-up, but it doesn’t adjust the axis. Please help.
Did you download the sample file? That should help you to debug the issue.
This worked well for me especially being a completely defined code. One item I noted is that there is case sensitivity like Max not max.
But many thanks for making this UDF.
Thanks, but I downloaded the example file and it only updates after I click the chart.
I change H13 (or H14, H15 etc) values and I have to click the chart so it updates the axis.
Am I missing something?
Thanks again!
What calculation mode are you in? As you will need to be in Automatic for it to trigger when the cell values changes.
Also, as the file has been downloaded from the internet, depending on your security settings, you may need to enable macros, or unblock the file.
THANK YOU SO MUCH FOR THIS! This was so very helpful!
Thanks Tom 🙂
I have a chart that I have moved to it’s own tab. The workbook I am building is a tool for others, and has the chart’s inputs on one tab and the chart itself on another. It’s designed this way to be used as a simple printable chart to include in reports. My issue is I have no way to name this chart as the name box is unavailable. Is there a way to make this code work with the data and chart on two separate tabs and an unnamed chart?
Hi Jesse – Check out the comment and response on the 5th and 11th April 2019. This should answer your question.
To the creator!
Good Day!
I commend you with this VBA codes, very useful. But it seems there is a problem that I encountered whenever I protect my sheet, this VBA doesn’t adjust the scale of my graph anymore.
Is there correction for this.
Thank you in advance
Hi – this methodology, does not work with protected sheets.
But there are other different ways which should work, but are less transferable – check out this post:
https://peltiertech.com/link-excel-chart-axis-scale-to-values-in-cells/
I’m pretty sure you’ll need to set protection to the user interface only – which is a secret excel setting. Look at the section entitled “Allowing VBA code to make changes, even when protected” in this post to find out how:
https://exceloffthegrid.com/vba-code-worksheet-protection/
This is gold! Thank you so much. Works like a charm.
Great – I’m glad it helped.
Hi, my code seems to work but the graphs do not update. I have tried to change the chartname to an incorrect name and that returns “#value!” so it is picking up the vba code (i presume) but the graphs do not update. Any idea?
Fount it – its capital letter sensitive (value vs Value)
Thanks, I loved it.
Awesome code but one problem I’m having is Excel crashing when I use this within a file that has control buttons that change the data that is being graphed.
I updated the code that some earlier comments had mentioned per below but that didn’t resolve the crashing when I click onto a different control button.
I changed:
Set cht = Application.Caller.Parent.Parent.Sheets(sheetName) _
.ChartObjects(chartName).Chart
into
Set cht = Sheets(sheetName).ChartObjects(chartName).Chart
Hi Rob – Thanks for reporting this issue. I’ve not tested it in this scenario before, but having done so, I agree that it does appear to cause stability issues. I’m not currently sure of the reason why.
HI there,
Great Function – However I have noticed that the undo button seems to stop working whenever this function is invoked. Do you know if there is some additional code I can input to stop this function running after every single change toe xcel so it stops clearing the registry (and therefore stopping the undo button form working)?
Thanks a lot.
Hi Mike – unfortunately any time a macro runs in Excel, it clears the undo stack. This is known feature/problem with Excel. Sorry, I’ve not got any solutions.
im getting a hashvalue error. I also want to be able to adjust the X and Y axis assuming both are numbers. CAn you please send me the spreadsheet so I can take a look as well. Much appreciated
There is a link towards the end of the post to download an example file.
Hi: code seems to work but must cause a memory leak. Excel runs out of memory when used. Recommends going to 64 bit version, however other of my add-ins are only available as 32 bit. any ideas?
How many charts are you using this for?
Thanks, for your solution. It worked pretty great also on big data.
Thanks so much for posting this. I implemented the solution with a primary and secondary axis on a line chart. It fills in the appropriate values on each axis but the chart now only displays the line for the primary Y axis and not the secondary X axis. Do you have any idea on why the line is not visible?
=setChartAxis(“Sheet2″,”Chart 4″,”Min”,”Y”,”Primary”,MIN(B24:B36))
=setChartAxis(“Sheet2″,”Chart 4″,”Max”,”Y”,”Primary”,MAX(B24:B36))
=setChartAxis(“Sheet2″,”Chart 4″,”Min”,”Y”,”Secondary”,MIN(C24:C36))
=setChartAxis(“Sheet2″,”Chart 4″,”Min”,”Y”,”Secondary”,MIN(C24:C36))
Looking at the formulas above, you’ve used Min twice. Look at the normal chart axis settings and see what min and max values the formulas have set, that might help reveal what the issue is.
Thanks so much for the quick reply. I corrected that formula but I am seeing the same result. The secondary axis min value is 33,201 and the max value is 42,201, those results are correct based on the data. So the formulas appear to be working properly because the min and max values on each axis are correct but the secondary line is still not appearing.
I am guessing that the secondary line is somehow tied to the primary axis (that would make it invisible) but I am not sure how that happened.
You are an amazing human being! Thank you so much for posting this, I’ve been looking everywhere for a solution but couldn’t find anything.
The formula worked the first time.
Thank you !
Firstly this is super helpful and your instructions are very clear, much appreciated!
Now I don’t believe this is possible and it’s a relatively minor point, but is there a way to add a “zig-zag” to indicate the y-axis has not started at zero?
Thanks
There are some complex tricks you can play using a fake axis. But I’m not aware of anything simple built into Excel.
Okay thanks I’ll check it out.
This is absolutely brilliant. Thank you.
Amazing. Well done. I was anxious to have a solution, somehow, implemented by MS like that for years… and now here it is! Thank you.
Is there a way to have this as a clickable macro/button for a sheet, the reason I ask is because I have about 10 of these formulas so the undo function doesn’t work and manual calculation is a step backwards.
Ideally if you could just click the button to trigger when to refresh the charts that would be perfect.
I’m not very familiar with UDF in Excel so not sure if this would be possible.
Thanks
Do you have any video to show the step of produce this function.
=setChartAxis(sheetName, chartName, MinOrMax, ValueOrCategory, PrimaryOrSecondary, Value)
I had tried but unable to get it. Really appreciate if have any video.
Thanks
No video at the moment. I have a YouTube channel now (https://www.youtube.com/channel/UCTx8QvRuF3BXTe5OIaVF9OA), so I may create a video.
Hi – I have been using this code for a couple of years. Really wonderful. Thank you.
I have a question that I have been unable to find a solution on the internet.
It seems the code does not work when I protect a sheet. Is it possible to add a line of code, and where, to be able to get your above code to work if I wanted to lock sheet? Thank you.
Also, even by protecting only one cell, I am still unable to get the charts to work. They stay stuck on the old range.
Sorry – I just saw the other answers way up there…
I’ll see if I find a workaround. Regardless, your code has been wonderful!
Thanks.
Thank you so much for this assistance. I had a quick question – can you help me understand how to save the function so that when someone else opens up the file on their individual computer, the function still works to auto update the chart axis?
Save the code, in a standard code module, in the same workbook as the charts. It will need to be an xlsm file type.
If you’re also using it in your Personal Macrobook, Excel may think it’s still referring to that UDF, rather than the one in the workbook. So I would recommend giving the UDF in the workbook a slightly different function name, so that it removes that problem.
Hi,
great code works perfect if I don’t protect sheets .If I protect sheet , it does not work. can any body suggest wayforward.
i have combined 2 pieces of code i found and it will update all graphs on all protected sheets in workbook, and maintain the protection
create button on first sheet of workbook and assign this
Sub ReCalc()
Dim i As Integer
Dim ws_num As Integer
Dim starting_ws As Worksheet
Set starting_ws = ActiveSheet
ws_num = ThisWorkbook.Worksheets.Count
For i = 1 To ws_num
ThisWorkbook.Worksheets(i).Activate
ActiveSheet.Unprotect “123”
ActiveSheet.EnableCalculation = False
ActiveSheet.EnableCalculation = True
ActiveSheet.Protect “123”
Next
starting_ws.Activate
End Sub
If you’re happy using a button to trigger the macro, then the approach from this post is not the right solution for you. Check out this post instead:
https://peltiertech.com/link-excel-chart-axis-scale-to-values-in-cells/
Thank you very much! This VBA saved my life today! Hugs!
Great stuff 🙂
This is amazing! I have a couple of questions:
[1]
If my chart is its own tab (instead of a chart inside a worksheet), how would i modify “sheetName” and “chartName” to work? I have tried to play, cant get it to work.
[2]
I would like to use a similar method to adjust “Vertical Axis crosses” axis value. Is this also controllable by UDF? If so, what is the method?
Thank you so much!
Hi Oliver – I think if you check through the comments above, you’ll find answers to similar questions, so check through those first.
This is great! Thank you very much!
One Question though:
How would the Syntax look if my Chart is not part of a datasheet, but outsourced to its own page in a xlsm file?
Look at the question and answer to John’s comment on April 5, 2019
I have a file that is uploaded online that uses this macro. The formula pulls numbers from data that is copied and pasted into the excel sheet. When I download a copy of it and paste in some data it gives me the #VALUE error. When I click on the formula and hit “Enter” (without changing a thing), it works properly. The problem is that I plan on making this excel file protected so the user wont be able to click “Enter”. When I do protect the sheet after clicking “Enter” on all of the formula (x-min, x-max, y-min, y-max), I can delete the pasted-in data and paste new data and it works fine, so long as I don’t save, exit, and reopen. Have you ever encountered this issue?
Check out this post:
https://peltiertech.com/link-excel-chart-axis-scale-to-values-in-cells/
great code, any tips on how to keep it working in a protected worksheet/
thanks
This is an experimental post about using User Defined Functions to control charts. Protection is an issue with UDF’s. An alternative approach is to use something like this:
https://peltiertech.com/link-excel-chart-axis-scale-to-values-in-cells/
wow this is amazing!!!!!!!!!!
i have looked all through this tread on how to get the code to update a chart thats on its on sheet i.e. a chart that is moved to its own sheet. i have not been able to locate anything on how to go about doing this on the tread. can you please guide me in the right direction.
Look at the question and answer to John’s comment on April 5, 2019
This is amazingly helpful. Thanks for sharing!
Hi there,
Great function! I was looking for such solution for some time. Many thanks for setting it up and sharing it. It really helped me solving a big problem.
Kind regards,
Ofer
Hi,
Great function!
Can it define the Axis Units Major and Minor as well?
Have a look at the conversation with Benno above, that should give you the answer.
Found the solution! Thanks.
I have another issue. Where the worksheet i would like to protect it as user will not accidentally override the formula or link.
I tried “Allowing VBA code to make changes, even when protected”. But after change the input for axis, it shown #VALUE error.
Once i unprotected the worksheet, it just work fine.
Not sure anything i done wrong or not. Can you advise.
Hi,
How can we define Vertical axis crosses?
At category number “Refer to cell number”?
Thanks.
I am trying to use dates in cells to update the X date axis as I only want to display the last 12 months. this looks like a way to do it, but I only get to change the axis to the full date range (01/01/2019 – 30/06/2021). Additionally I have never used Developer / VBA / Modules before – are there some steps missing – for real beginners, or is there an idiots guide I could check out before attempting this? I am also assuming I could copy the =setchartaxis….. to cells all over the page with 20 graphs and reference the same start/finish cells – as I am trying to save time messing around formatting all axis every month. Thanks.
Hi, Thanks for making this available. It works great, except for when the value is negative for either MIN or MAX or both. Then you get a value error. Any suggestions on how to modify the VBA to fix that. Best
Thank you! This worked perfectly for my Financial Dashboard.
This has changed my graph sheets functionality. So nice.
Thank You – worked just fine first time for my simple spreadhseet.
Hey Hey,
Working on implementing this code and having trouble with the “X” or “Category” axis. I cannot get the chart to reformat to the Max value I have assigned. I get the #VALUE error too. I have tried setting x axis to number, general and setting the cell value to number and or general too.
I have tried to set the Min value for the “Category” too and while I don’t get a #VALUE error, the chart does not change. I am using integers, not dates for my x-axis.
Any suggestions?
Have you tried downloading the sample file, and see if that works for your scenario?
FANTASTIC!!!!!!!!!!!!
Been wanting to do this for years.
Thank you. Thank you. Thank you. Thank you. Thank you. Thank you. Thank you. Thank you. Thank you. Thank you. Thank you. Thank you. Thank you. Thank you. Thank you. Thank you. Thank you. Thank you. Thank you. Thank you. Thank you. Thank you. Thank you. Thank you.
How did I not find “EXCEL Off the Grid” until now????????
metsci
hey this is amazing, I wonder if it would be possible to have this working when the chart is actually a single sheet object
I tried to reference to the chart in a seperate sheet but the function returns #VALUE! error
If you look at some of the comments above, this has been answered already.
Hi I have used this macro before & really liked it. But I have added it to a new spreadsheet & it works on the Y axis, but not the X axis, where I get a #VALUE error. I have looked but I can’t see why one works & not the other – any suggestions?
Many thanks
Check that all the formula parameters are correct, as that’s the most likely cause. Also, check the axis type is correct – you may need to use a date axis if the number on the axis is not a position.
This is a great solution. Now on your your dynamic chart title changing.
Thank you!!!!
Thanks Thomas 🙂
Freaking sweet. Thanks!
Hi, I am trying to incorporate this into one of my sheets, I’m no expert in excel and would appreciate your help, for the value you set for max and min I want to set it to an average of a data set that’s in another cell, as this will change I want the value to be set to the cell so I don’t have to change the number myself every time, is this possible?
You are great, thank you for sharing your functions. It saves lot’s of time and makes functional and dynamic work.
You should share that with Microsoft, they have been requested this function for years, now that is figured out in a smart way, they just should include it.
There was a suggestion on the User Voice site, which the Excel team confirmed is not currently on the road map. So I’m not expecting this anytime soon.
Is it possible to modify the function to apply to multiple charts within a single worksheet? I was thinking a loop when defining the ChartObjects but I can’t quite get the syntax right.
Hi Tiffany – I don’t think you need to modify the code. The point of the function is to have 1 function for each chart. So if you have 5 charts, you need 5 functions.
Hello
I love the function. I have a little problem with it though.
If I copy the workbook including this function some of the instances where the function is used in the new workbook get a #NAME? error.
Then if I click the fx icon I am told this function takes no arguments.
Any ideas of what is going wrong?
Hi Andre,
Do you mean that you copy the worksheet (rather than the workbook). If you copy a sheet there is the chance that the formulas is still looking at the UDF within the original workbook. Take a look a the formula, it may contain the file path to the original formula.?
Thanks,
Mark
Hi,
Firstly LOVE this function – such a powerful tool. Thank you!
Like many others it works great – until the document is protected.
Granted the following may not be a solution for everyone but maybe can be adapted by those who know more coding than me.
I eventually stumbled on this little addition to the protection code:
Activesheet.Protect Password:=”Password”, UserInterfaceOnly:=True
Which allows macros to run on protected sheets.
Along with adding “Application.Volatile” into this UFD (which seems to cause some people issues in comments – personally not had a problem so far)
So my basic macro set up is now:
Sub Worksheet_Open()
For Each wSheet In Worksheets
wSheet.Protect PASSWORD:=”Password”, UserInterFaceOnly:=True
Next wSheet
End Sub
Sub Workbook_BeforeSave
For Each wSheet In Worksheets
wSheet.UnProtect PASSWORD:=”Password”
‘Lots of other code I use here…’
ActiveSheet.Calculate
wSheet.Protect PASSWORD:=”Password”, UserInterFaceOnly:=True
Next wSheet
End Sub
Now I have multiple protected worksheets and multiple charts in one workbook that can change based on my limits.
Hope this makes some sense – finally trying to give back after years of googling codes.
I embedded this function into a series of sheets I created and it seemed to have been working fine until recently. Now when I sort data using a filter on some data, on a different tab than the formulas and charts are, excel will shut down – no warnings just blip off. At one point I had the data from that tab on the chart – but I removed it but it still auto shuts off when I sort. I tried a ton of tests deleting various tabs, adjusting the formulas where I feed the chart values etc. but the problem only goes away when I break the formulas that associate the chart to the values I desire. Have you heard of this issue before?
I have seen this issue before, when the UDF included Application.Volatile at the start. After removing that it worked fine. Have you amended the code in anyway?
Hello,
I am trying to have a scatter chart for which both vertical and horizontal axis would cross based on 2 cells value (one for vertical axis, one for horizontal). For the moment, excel allows me to set a value but not based on a cell value. Would you have a solution for me?
Many thanks
Hello, I am getting error using the code while trying to plot “time”as category axis. Any suggestion how to fix this? the value axis is working fine.
Hi there!
Is it possible to implement this code on multiple charts at once?
I want to set the limit of multiple charts by changing just one cell. Also there are many charts so referencing all the “setChartAxis” functions to
a single cell wouldn’t be most optimal option.
You will need one formula for each chart. But each formula could be referencing the same cell as an input. This method isn’t the most efficient, but it is portable. There are other options using worksheet events that may be better for your scenario.
Dear sir,
Same problem with your sheet, I’m facing a problem this solution or UFD not working with protected sheet, any solution please?
UDF’s don’t work on protected sheets. There are alternative methods using VBA change events that may be better with your scenario.
No need for sheetName
Set cht = Application.Caller.Parent.Parent.Sheets(sheetName) _
.ChartObjects(chartName).Chart
can be replaced by (tested in Office 2016)
Set cht = Application.Caller.Worksheet.ChartObjects(chartName).Chart
It depends if the formula and chart are on the same sheet. I wrote the code to work on any sheet in the workbook. But if they are all on the same sheet then your version is fine.
Thanks so much for this.
I am using it in one of my Stock Chart programs. Works like a dream.
I change TIKRs to get a next chart. Your Function instantly auto updates my Y scales [primary and secondary] to the values I specify for each TIKR in my program. I used to do this w a macro. This method is better. It is very useful in helping me determine the min max values I want on my chart for each tikr.
Great news 🙂
Extremely helpful. Thanks a lot!
This would be super useful for a project I’m doing for work, but I wanted to make sure it was okay to actually use it first. You did really great work with it, so I’d definitely give credit to you when doing so. Thanks a lot for your help!
Yes, it’s here for you to use in any context you want. No need to give credit.
That’s really cool of you. Thank you so much!
Thanks so much! Works super well, and solves a longstanding problem with a sheet that many people use. Much appreciated.
Great news 😀
Works great! Thanks for posting – easy and clear instructions
Hi Mark,
Thank you very much for this. This solution was crucial in the creation of an excel dashboard for my stakeholders. Unfortunately I’m coming across a critical bug. When I apply page layout formatting to my file for printing out charts using this macro, the macro no longer works and receives an error. This prevents the axes from adjusting automatically. I am wondering how to resolve this for more widespread use.
Do you know how to go about troubleshooting this? If it helps, I can also email you two copies of a file I’m working on – one with page layout formatting and one without.
Thanks again!