This post looks at how to calculate CAGR in Excel. CAGR stands for Compound Annual Growth Rate; it calculates the annual percentage growth over a period of time, where growth is compounded each year.
CAGR is often used in finance to understand how different investments have performed over time.
Excel does not have its own CAGR function, but it is simple enough to calculate using other formulas.
Table of Contents
Download the example file: Join the free Insiders Program and gain access to the example file used for this post.
File name: 0063 Calculate CAGR in Excel.xlsx
What is CAGR (Compound Annual Growth Rate)?
Let’s start by understanding what CAGR (Compound Annual Growth Rate) is.
A simple CAGR example
As a simple example, if you invest $100 in a savings account with a 10% fixed interest rate. After 1 year, your account has earned $10 interest and is now worth $110. Since your account now has $110, the interest in year 2 is higher at $11, making the balance $121. We are now receiving interest on previously earned interest. This is known as compounding; the interest earned is added to the total each year, providing a larger base value for the next interest calculation.
After 5 years, the value of that account would be $161. If all we knew about the account was that it started at $100 and after 5 years was worth $161, how could we calculate the interest rate? This is where compound annual growth rate comes in.
Even though rates of return can change over time, CAGR calculates the mean average compound rate over any time period.
In summary, CAGR is the consistent annual percentage growth required for a value to grow from the start value to the end value, assuming the increase is added to the base value each year.
A more realistic CAGR example
Now, let’s take a look at a more realistic example
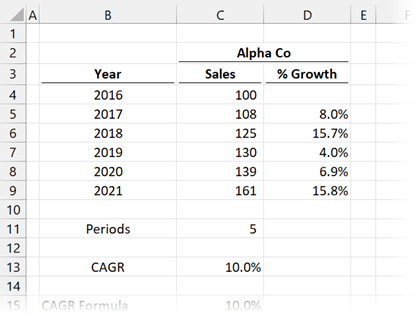
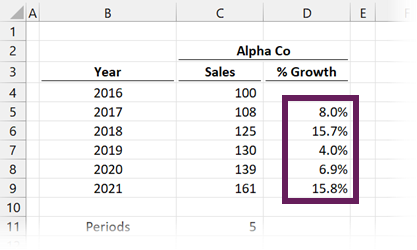
In the screenshot above, sales for Alpha Co increased from $100m in 2016 to $161m in 2021. The growth was not consistent; it fluctuated between 4.0% and 15.8%.
The CAGR calculated in Cell C13 is 10%. As the start and end values are the same as in the simple example above, CAGR calculates the same result.
Proving the compound annual growth rate (CAGR) calculation
Let’s prove this calculation to ensure it is compounding the annual growth rate as we are expecting.
In the example above, Alpha Co has a start value of $100m, with 10% CAGR, so what is the value after 5 years.
- Method 1: $100m x 1.1 x 1.1 x 1.1 x 1.1 x 1.1 = $161m
- Method 2: $100 x 1.1^5 = $161m
There we have it. By using the CAGR, we can calculate the same end result of $161m. Hopefully, that gives you a good understanding of how CAGR works and what it means. The next question is, how to calculate CAGR in Excel?
How to calculate CAGR in Excel
Where is the CAGR function in Excel, you ask? …. Er, there isn’t one. What! No CAGR function! What are we going to do?
Don’t worry; instead, we get to choose from many possible ways to calculate the result.
CAGR formula in Excel
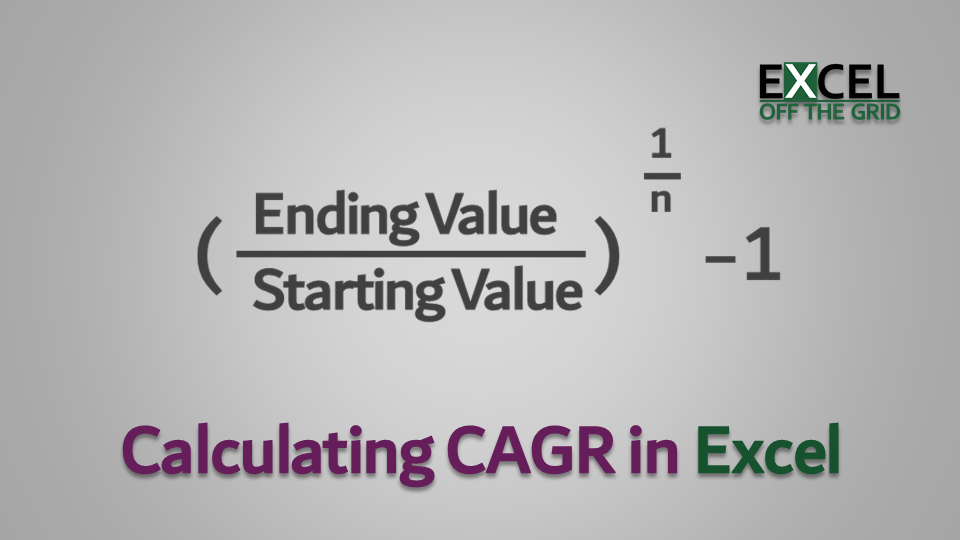
The basic CAGR formula is :
CAGR = (EV ÷ BV) ^ (1 ÷ n) – 1
- EV = Ending Value
- BV = Beginning Value
- n = Periods between Beginning and Ending
Using the CAGR formula in Excel
Once we know the basic calculation, it is easy enough to apply the CAGR formula in Excel.
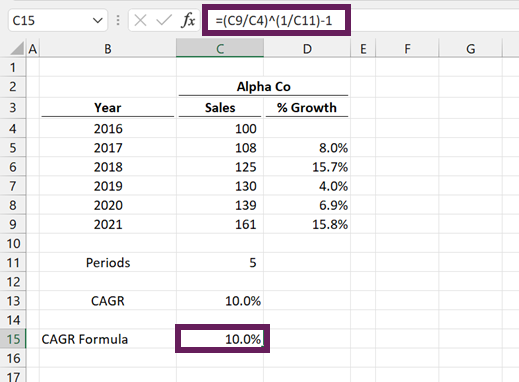
The formula in Cell C15 is:
=(C9/C4)^(1/C11)-1- C9 = 161 (the Ending Value)
- C4 = 100 (the Beginning Value)
- C11 = 5 (number of periods)
Result: 10%
RRI function
There is an easier option than the generic CAGR formula, the RRI function.
The RRI function in Excel calculates the interest rate for the growth of an investment. Hmmm… 🤔 sounds just like the CAGR formula with a different name.
If we know the present value, future value, and the number of years in between, it calculates the annual growth percentage.
Arguments of RRI function
The RRI function has the following syntax:
=RRI(Nper, Pv, Fv)
- Nper: Number of periods
- Pv: Present value (or Beginning Value)
- Fv: Future value (or Ending Value)
Example using RRI function
OK, let’s use the RRI function on Alpha Co within our example.
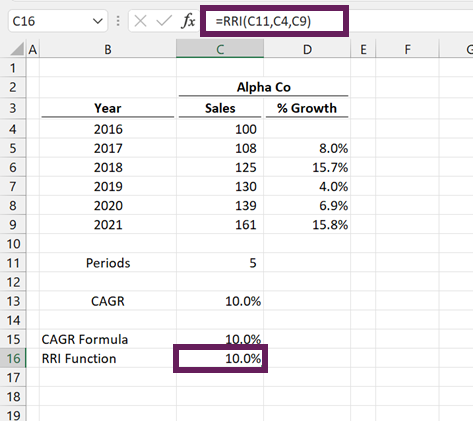
The formula in Cell C16 is:
=RRI(C11,C4,C9)
- C11 = 5 (number of periods)
- C4 = 100 (the Beginning Value)
- C9 = 161 (the Ending Value)
Result: 10%
RATE function
A similar and related function to RRI is the RATE function.
The RATE function in Excel calculates the interest rate per period of a loan or investment.
Arguments of the RATE function
The RATE function has the following syntax:
=RATE(Nper, Pmt, Pv, [Fv], [Type], [Guess])
- Nper: Number of periods
- Pmt: The consistent payment made each period
- Pv: Present value
- [Fv]: Future value. This is an optional argument; if omitted, the value is assumed to be 0.
- [Type]: An optional argument to represent if repayment is made at the:
- 1 = beginning of the period
- 0 or omitted = end of the period
- [Guess]: The guess of what the rate could be. This is an optional argument; if omitted, it is assumed to be 0.1 (10%).
The RATE function calculates the interest rate on a loan repaid over time. Using the RATE function with zero repayments and a negative present value provides the same result as the RRI function.
Example using the RATE function
Let’s look at an example using the RATE function.
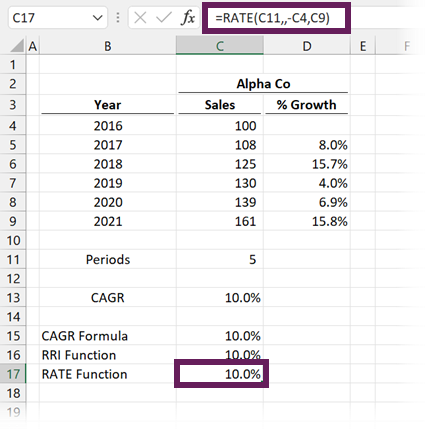
The formula in Cell C17 is:
=RATE(C11,,-C4,C9)
- C11 = 5 (number of periods)
- C4 = 100 (the Beginning Value) -make this negative to calculate CAGR
- C9 = 161 (the Ending Value)
Result: 10%
POWER function
We’ve seen that RATE and RRI are built-in Excel functions that replicate the basic CAGR formula. We don’t see how those functions work; we just trust that Excel calculates the result as expected.
An alternative option that is similar to the original mathematical calculation is to use Excel’s POWER function. This function returns the result of a number raised to a power.
Arguments of the POWER function
The POWER function in Excel has the following syntax:
=POWER(Number, Power)
- Number: The base number; can be any real number
- Power: The exponent to which the base number is raised
Example using the POWER function
Using Alpha Co as our example once again:
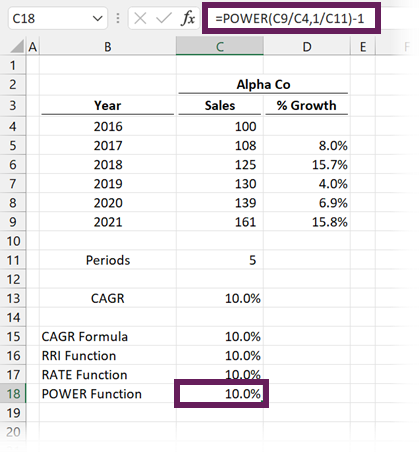
The formula in Cell C18 is:
=POWER(C9/C4,1/C11)-1
- C9 = 161 (the Ending Value)
- C4 = 100 (the Beginning Value)
- C11 = 5 (number of periods)
Result: 10%
Hopefully, by looking at this method, you can see how this replicates the mathematical approach we looked at initially.
GEOMEAN function
For the final method to calculate CAGR, I want to change the scenario slightly. What if we have the annual growth percentages for each year, but not the exact values? Imagine we only had the values in Cells D5-D9 (see screenshot below); what could we do?
For this type of scenario, we use the GEOMEAN function.
GEOMEAN calculates the average growth rate even where there is compounding with variable rates over time. Therefore, this is the perfect function to calculate CAGR from a list of individual growth rates.
Arguments of the GEOMEAN function
The GEOMEAN function in Excel has the following syntax:
=GEOMEAN(Number1, [Number2],...)
- Number1: The number, array, or cell references that contain the values for which to calculate the result
- [Number2]…: The GEOMEAN function can take up to 255 arguments of arrays or cell references to include in the calculation
Example using the GEOMEAN function
Using Alpha Co as our example once again.
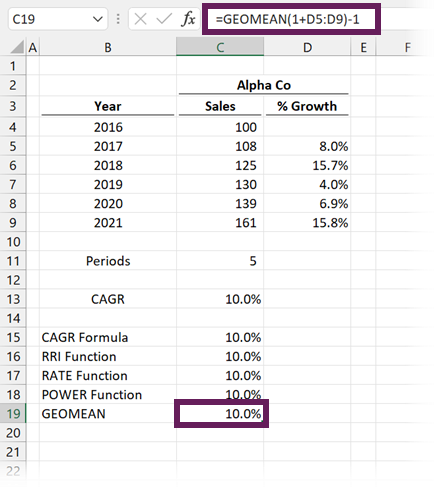
The formula in Cell C19 is:
=GEOMEAN(1+D5:D9)-1
- (1+D5:D9) = is the range of numbers from which to calculate the GEOMEAN. We need to add 1 to each percentage to calculate the growth factor.
- -1 = is used at the end to return the calculated growth factor back to a percentage increase.
Result: 10%
Note: If you do not have a dynamic array-enabled version of Excel (Excel 2019 and prior), you will need to press Ctrl + Shift + Enter to commit this formula.
Online CAGR calculator & Excel Download
All of the CAGR formula examples are included in the Excel download file, which can be found at the top of this post.
But, if you’re looking for a quick CAGR online calculator, Vertex 42 have an easy tool to use. https://www.vertex42.com/Calculators/cagr-calculator.html
It can calculate any of the inputs without worrying about Excel formulas:
Conclusion
There you go, that’s how to calculate CAGR in Excel.
As we’ve seen, across each example, they all evaluate to the same result, but with different approaches. So, whether we use the basic CAGR formula in Excel or one of the built-in functions, we can choose the one which best fits our way of thinking.
Related Posts:
- How to calculate Weighted Average in Excel (3 easy examples)
- Excel’s AVERAGE function – the hidden pitfalls
Discover how you can automate your work with our Excel courses and tools.
The Excel Academy

Make working late a thing of the past.
The Excel Academy is Excel training for professionals who want to save time.