Imagine you’ve created a beautiful chart for your Excel report. You decide to hide the source data because the report’s users don’t need to see that. Suddenly the information in the chart disappears. So, this raises the question: how to show hidden data in an Excel chart?
We answer this question in this post. But, we go further. We also look at how we can use this technique for more advanced user interactivity.
Table of Contents
- How to show hidden data in an Excel chart
- Use hidden data to create dynamic charts
- VBA code to toggle between showing hidden/visible data
- Toggle hidden cells for active chart
- Toggle hidden cells for all charts on worksheet
- Apply hidden setting of active chart to charts on same worksheet
- Office Scripts to toggle between showing hidden/visible data
- Toggle hidden cells for active chart
- Toggle hidden cells for all charts on worksheet
- Apply hidden setting of active chart to charts on same worksheet
- Conclusion
Download the example file: Join the free Insiders Program and gain access to the example file used for this post.
File name: 0113 Show hidden data in Excel chart.zip
Watch the video
How to show hidden data in an Excel chart
The option to display or hide chart data is set on a chart-by-chart basis. It is one of those settings you have probably seen many times but never noticed it.
To show hidden data in an Excel chart:
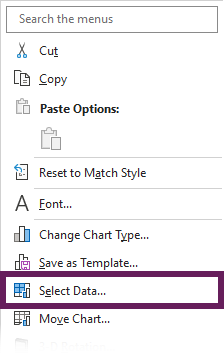
- Right-click on the chart. Click Select Data… from the menu.
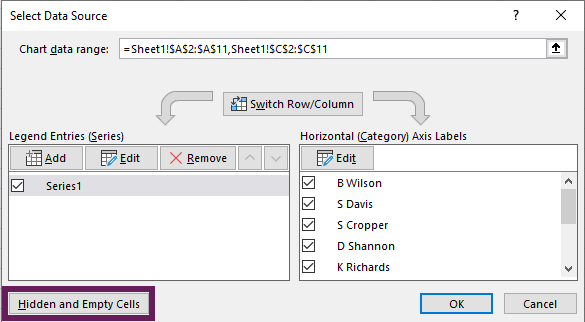
- In the Select Data Source dialog box, click the Hidden and Empty Cells button.
- The Hidden and Empty Cells Settings dialog box opens. Enable Show data in hidden rows and columns, then click OK.
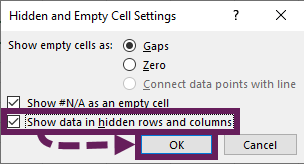
- Click OK again to close the data source settings dialog box.
That’s it, that’s all it takes. The chart information is now visible again. Take a mental note of the additional settings in the Hidden and Empty Cells Settings dialog box; you never know when they might be useful.
Use hidden data to create dynamic charts
Initially, the feature to displaying hidden data may seem annoying. However, it actually creates a new level of flexibility for displaying charts. By combining this setting with AutoFilter, or an Excel Table, we can specify which rows to display inside a chart.
Example
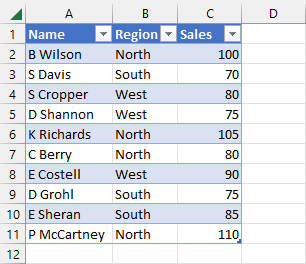
The following is the source data for a chart:
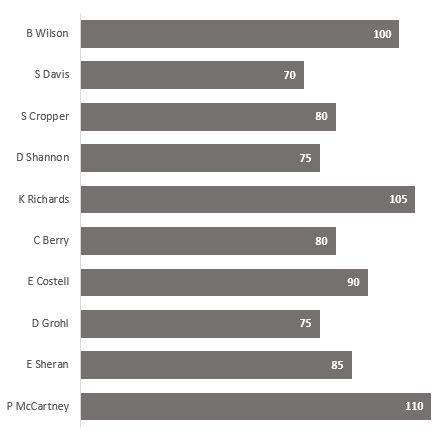
That source data as a bar chart displays as follows:
As the graph is connected to the Table, filtering the Table shows only the selected items in the chart.
As an example, I have selected North in the Region column of the Table. Therefore, the chart also updates displays only the North region.
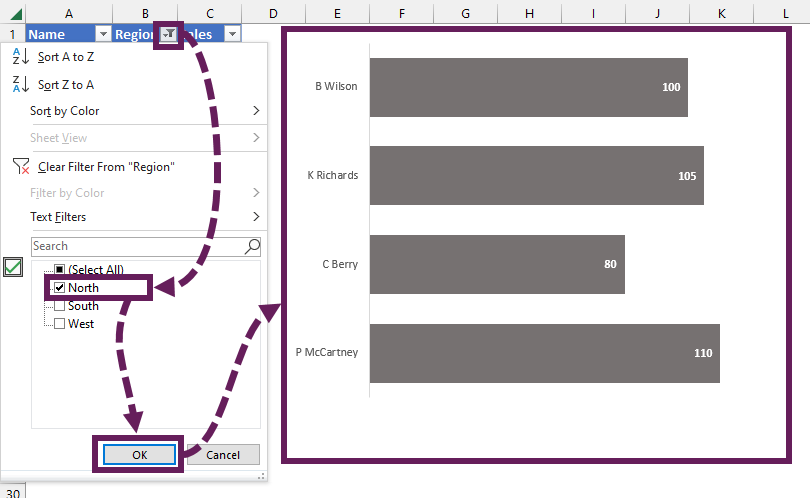
This creates a flexible dashboard-style interactivity by harnessing the power of hidden rows.
VBA code to toggle between showing hidden/visible data
If we have a lot of charts, it can be time-consuming to apply this to each chart individually. The following VBA codes toggle the hidden cells setting in various scenarios.
For other VBA chart examples, check out this post: Ultimate Guide: VBA for Charts & Graphs in Excel (100+ examples)
Toggle hidden cells for active chart
The following code toggles the hidden cells setting on the active chart only.
Sub ToggleChartDisplayHiddenRows()

'Declare and assign variable
Dim cht As Chart
Set cht = ActiveChart

'Ignore errors if no chart active
On Error Resume Next

'Toggle hidden data visibility
cht.PlotVisibleOnly = Not cht.PlotVisibleOnly

On Error GoTo 0

End Sub
Toggle hidden cells for all charts on worksheet
The following code toggles the hidden cells for each chart.
Sub ToggleChartDisplayHiddenRowsAllOnSheet()

'Declare and assign variable
Dim chtObj As ChartObject

'Loop through all charts on the worksheet
For Each chtObj In ActiveSheet.ChartObjects

    'Toggle hidden data visibility
    chtObj.Chart.PlotVisibleOnly = Not chtObj.Chart.PlotVisibleOnly

Next

On Error GoTo 0

End Sub
Apply hidden setting of active chart to charts on same worksheet
The following code changes the setting for every chart on the worksheet to be identical to the active sheet.
Sub ToggleChartDisplayHiddenRowsSameAsActive()

'Declare and assign variable
Dim chtObj As ChartObject
Dim hiddenRowsSetting As Boolean

'Capture the PlotVisibility of active chart
hiddenRowsSetting = ActiveChart.PlotVisibleOnly

'Ignore errors if no chart active
On Error Resume Next

'Loop through all charts on the worksheet
For Each chtObj In ActiveSheet.ChartObjects

    'Toggle hidden data visibility
    chtObj.Chart.PlotVisibleOnly = hiddenRowsSetting

Next

On Error GoTo 0

End Sub
Office Scripts to toggle between showing hidden/visible data
Below are 3 Office Scripts that perform the same tasks as the VBA codes above.
Toggle hidden cells for active chart
The following script toggles the hidden cells setting on the active chart.
function main(workbook: ExcelScript.Workbook) {

//Declare and assign variable
let cht = workbook.getActiveChart()

//Ignore errors
try {
  //Toggle hidden data visibility
  cht.setPlotVisibleOnly(!cht.getPlotVisibleOnly())
} catch (err) {

}

}
Toggle hidden cells for all charts on worksheet
The following script toggles the hidden cells for every chart on the active worksheet.
function main(workbook: ExcelScript.Workbook) {

//Declare and assign variable
let ws = workbook.getActiveWorksheet()
let chtArr = ws.getCharts();

//Loop through all charts on the worksheet
for (let i = 0; i < chtArr.length; i++) {

  //Ignore errors
  try {
    //Toggle hidden data visibility
    chtArr[i].setPlotVisibleOnly(!chtArr[i].getPlotVisibleOnly())
  } catch (err) {

  }
}

}
Apply hidden setting of active chart to charts on same worksheet
The following script changes every chart on the worksheet to have the same setting as the active sheet.
function main(workbook: ExcelScript.Workbook) {

//Declare and assign variable
let ws = workbook.getActiveWorksheet()
let chtArr = ws.getCharts();

//Loop through all charts on the worksheet
for (let i = 0; i < chtArr.length; i++) {

  //Ignore errors
  try {
    //Toggle hidden data visibility
    chtArr[i].setPlotVisibleOnly(workbook.getActiveChart().getPlotVisibleOnly())
  } catch (err) {
  }
}

}
Conclusion
In this post, we have seen it is easy to show hidden data in an Excel chart. Then we saw how to harness the power of this feature to create dynamic charts which update based on filter selection. Finally, we looked at VBA and Office Scripts methods to automate changing the Show data in hidden rows and columns setting.
Discover how you can automate your work with our Excel courses and tools.
The Excel Academy

Make working late a thing of the past.
The Excel Academy is Excel training for professionals who want to save time.