In this post, we look at how to forecast seasonality in Excel. I have previously written about forecasting seasonality using the FORECAST function. However, with Excel 2016, Microsoft gave us an easier method for forecasting seasonality. Rather than using the FORECAST function with a lot of trickery, we can simply use the FORECAST.ETS function by itself.
Since support for Excel 2013 ends in April 2023, this method of forecasting seasonality in Excel should be the predominant method. If you are using Excel 2013 or prior, check out my previous post here: https://exceloffthegrid.com/using-the-forecast-function-with-seasonality/
Table of Contents
Download the example file: Join the free Insiders Program and gain access to the example file used for this post.
File name: 0057 Forecast with Seasonality FORECAST.ETS.xlsx
Watch the video

The Scenario
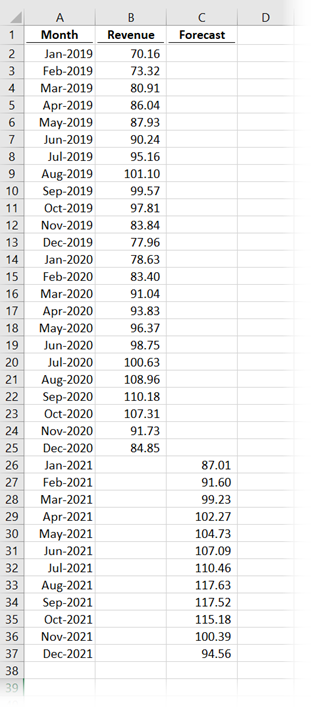
The table below contains the Excel data used to demonstrate the techniques and functions.
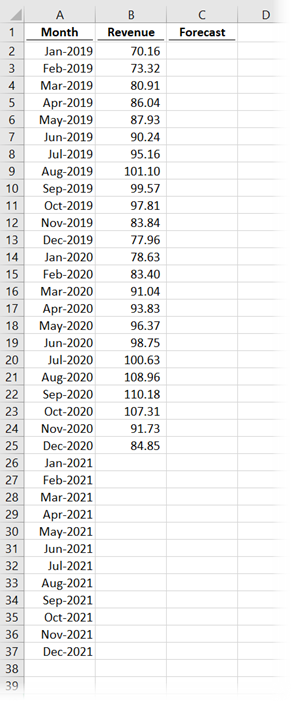
There are 24 months of historical data in the example. The goal is to create a forecast for the next 12 months which maintains the same seasonality pattern.
What you may not be able to see from the data above is an underlying level of growth. Therefore, not only is there seasonality to deal with but also a growth factor to consider. The good news is that FORECAST.ETS makes this simple.
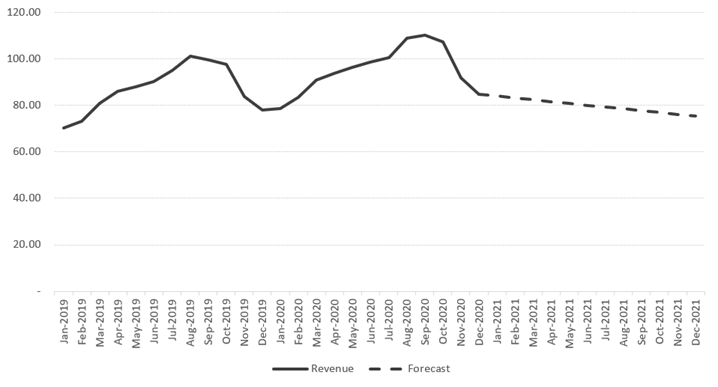
The final output we create looks like this:
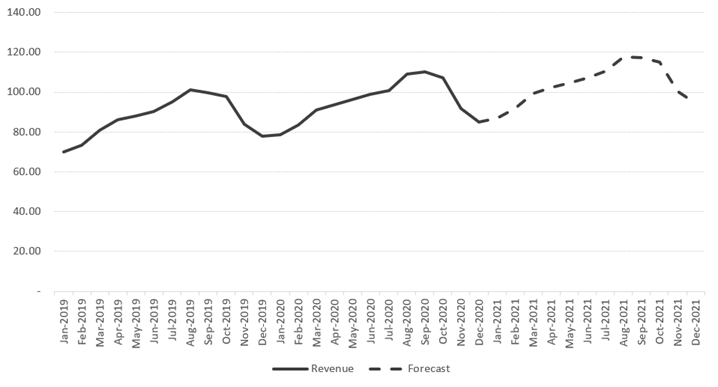
The solid line is the historical values, and the dotted line is the seasonal forecast, as calculated by FORECAST.ETS.
The arguments of the FORECAST.ETS function
The FORECAST.ETS function on Excel calculates seasonal results using an exponential smoothing algorithm. The syntax of the function is:
=FORECAST.ETS(target_date, values, timeline, [seasonality], [data_completion], [aggregation])- target_date: The date for which we want Excel to predict a value. It can be a numeric or date/time value.
- values: The historical values on which to base the future forecast.
- timeline: The array or range of dates corresponding to the items in the values argument above. All dates in the timeline must have a consistent step between them and can’t be zero.
Note: The timeline doesn’t need to be sorted in date order; Excel will automatically sort the data in memory before performing the calculation. - [seasonality]: An optional value that represents the length of the seasonal pattern.
- 1 = Excel automatically detects the seasonal pattern (this is the default if not provided)
- 0 = Apply a linear calculation rather than a seasonal forecast
- Any other whole number less than 8,760 = the length of the repeating pattern. For example, to forecast seasonality over a year with monthly data, the number would be 12.
- [data_completion]: An optional value of 1 or 0. The function can work with up to 30% of missing data.
- 1 = missing data is calculated as the average of the neighboring data points (the default, if argument not provided)
- 0 = missing data should be treated as zeros
- [aggregation]: An optional argument detailing how multiple values with the same time stamp should be treated.
- 1 = AVERAGE (the default, if argument not provided)
- 2 = COUNT
- 3 = COUNTA
- 4 = MAX
- 5 = MEDIAN
- 6 = MIN
- 7 = SUM
Find out more about the FORECAST.ETS function here: https://support.microsoft.com/en-us/office/forecast-ets-function-15389b8b-677e-4fbd-bd95-21d464333f41
Forecast seasonality in Excel
OK, now we know how FORECAST.ETS works. Let’s put it to the test.
If you’re working along with the example file, enter the following formula into cell C26:
=FORECAST.ETS(A26,$B$2:$B$25,$A$2:$A$25,12)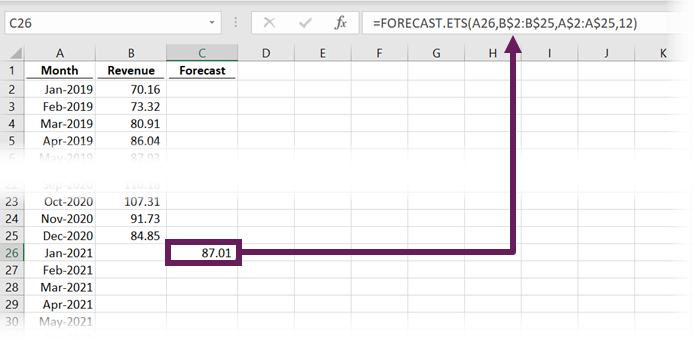
- A26 – The date for which we want to calculate the value.
- B$2:B$25 – The range of previous values on which the forecast is based
- A$2:A$25 – The dates of the previous values on which the forecast is based
- 12 – The seasonality pattern is 12 because they are monthly values.
We are not using the optional data_completion or aggregation arguments in this example.
Now copy the formula down. Provided you put your $ symbols in the right place, you should get the following.
Let’s create a line chart to easily see the results in action.
I have added =NA() function into the blank cells so that they are not rendered on the chart (this is visible in the example file).
BOOM!!! Done. That was so easy. Not only has Excel recognized the seasonality but also the underlying growth rate.
Common errors
FORECAST.ETS performs some quite complex calculations. Therefore, FORECAST.ETS can be susceptible to lots of different types of errors. Excel can’t calculate a suitable value if we don’t use the correct arguments.
The most common errors are:
#VALUE!
- The target_date, seasonality, data_completion, or aggregation arguments contain non-numeric values.
- The timeline contains duplicate values.
#N/A
- The values and timeline are not of the same length.
#NUM
- A consistent step cannot be found within the timeline.
- The value for the seasonality argument is not a whole number between 0 and 8764
- The value for the data_completion argument is not 0 or 1.
- The value for the aggregation argument is not a whole number from 1 to 7.
How good is Excel at predicting the seasonal pattern?
We usually know precisely how long a season is: quarterly, monthly, weekly, daily, etc. But if we don’t, should we trust Excel to do it for us?
As an example, I updated the function so that Excel automatically calculates the seasonality argument.
Oh dear, that’s really not what we want!!!
It looks like Excel’s seasonality-finding algorithm may not be that useful. To calculate seasonal forecast in Excel, then it seems like we are best to enter the seasonality value ourselves 🙂
Conclusion
Before Excel 2016, seasonality calculations required a lot of additional steps. However, with the introduction of the FORECAST.ETS function, to forecast seasonality in Excel is now easy.
Discover how you can automate your work with our Excel courses and tools.
The Excel Academy

Make working late a thing of the past.
The Excel Academy is Excel training for professionals who want to save time.
I’ve found that FORECAST.ETS needs about three whole cycles to detect the seasonality. When it does autodetect something with insufficient data, it may think there are 11 or 13 periods instead of 12.
That’s good to know. I couldn’t find anything documented about how many cycles it needed.
In addition to John Peltier’s post, if you use the FORECAST.ETS.SEASONALITY() function, it will give you a seasonality value of 0. If you use 0 in your FORECAST.ETS() formula, it will give you different but good results even though you said, it’s not the result you want!
Why did I say the result of using 0 for seasonality is good? Because FORECAST.ETS() is aimed at additive data and I think your data are more multiplicative than additive. If you find the absolute changes from period to period, you will see that the changes are not constant, which is what you should expect from additive data.
Finally, using a scatter graph rather than a line graph obviates the need for the NA() function, although as a learning point that is a valuable addition to the page