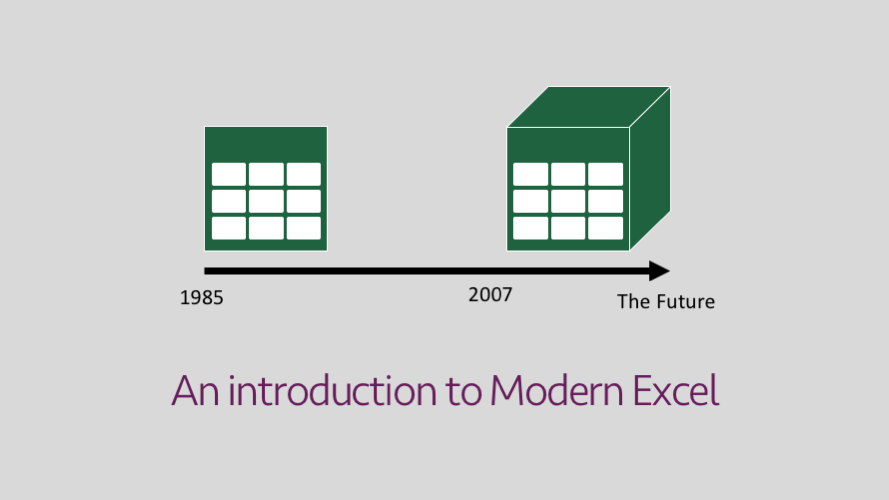
Back in 2007, the Excel data revolution started. At the time we saw a few new features, a new menu layout, a new file format, and 983,040 additional rows. We had no idea of the plans Microsoft had for Excel, but it was all laying the groundwork for what was to come. In the following years, a variety of new tools were added, turning the world’s best spreadsheet application into a data powerhouse. It is these tools which form “Modern Excel”.
Initially, these new tools were restricted to specific versions of Excel. By versions, I don’t just mean Excel 2010 or Excel 2013, but also whether it is the Professional Plus edition or another edition. Over time, Microsoft has included more of the Modern Excel tools within the lower spec editions. Therefore, these are now becoming tools for every Excel user, rather than just those working in enterprise situations.
It all gets a bit complicated with all different versions and understanding which tools now work with which, so I won’t waste too much time here trying to explain it. Do a quick Google search to find out what will work with your version.
What is Modern Excel?
I’m not sure who coined the phrase “Modern Excel” (Rob Collie maybe), but it appears to have been adopted to describe the suite of new tools. Here is a summary of what each of these tools does.
Get & Transform (Power Query)
If using Excel 2010 or Excel 2013 there is an Add-in available called Power Query. The Add-in creates a new Ribbon on the menu with all the new Power Query features. But, if using Excel 2016 or Excel 365, the good news is that Power Query is built-in. Though for whatever reason Microsoft decided to rename it to “Get & Transform”. The name Get & Transform does not sound as exciting as Power Query, but it really is the same tool.
What does Get & Transform (Power Query) do?
Get & Transform is an ETL tool, (“a what?” I hear you say). ETL stands for Extract, Transform and Load. Let’s consider each of these words to help understand what Get & Transform does.
- Extract – Data can be extracted from a variety of sources; databases, CSV files, text files and Excel workbooks. It’s even possible to work with multiple files at the same time.
- Transform – Once the data has been extracted, it can be cleaned up (i.e., remove spaces, split columns, change date formats, fill blanks, find and replace etc) and reshaped (i.e., unpivot, remove columns etc).
- Load – Once transformed the data can be pused into a spreadsheet or other Modern Excel tools for further manipulation.
Basically, Get & Transform takes data from a variety of sources (including unstructured data) and changes it into something which can be used easily.
Once the ETL process has been created in Get & Transform, it can be run over and over again, automatically extracting, transforming and loading new data with a single refresh. This tool alone can save hours of work every week.
If you’re still a bit confused, I will share some examples, which hopefully indicate how useful Get & Transform is.
Example 1: Data is stored in a CSV file. Normally you have to open the CSV, copy the relevant columns into your spreadsheet then use a lot of LEFT and RIGHT formulas to split specific fields, finally using a PivotTable to get the data into the right format. You could do this with Get and Transform, which could refresh for a new CSV file with a single click.
Example 2: You receive 30 Excel workbooks from different divisions of your business, all in the same format. You open each spreadsheet and copy the data into a master spreadsheet. However, if you saved all the workbooks in the same folder, with Get &Transform you could consolidate the data at once with a single refresh. (no copy and paste required!).
Example 3: Your business has just acquired a new company. Unfortunately, their software system is different and management have no intention of changing it, but you are expected to create a consolidated product reports each week. Sounds like a lot of work. With Get & Transform you may be able to get a link directly into each system and with the use of an Excel mapping table consolidate all the data each week with a single refresh.
How difficult is Get & Transform to learn?
To pick up the main interface, there is a bit learning curve. The challenge is understanding what each section and button does. But once you’ve got the hang of it, it is pretty straightforward. 99% of the benefit can be achieved entirely through the simple interface.
There is also a lot of depth here, as Get & Transform includes its own programming language called “M”. Most users can get a lot of benefit without ever touching the M language, but anybody who wants to go deeper to find more power has that option.
Power Pivot
Power Pivot is available for certain versions of Excel 2010, 2013 and 2016. The great news is that Since April 2018, all versions of Excel 365 and Excel 2016 come with Power Pivot included. It is within the COM Add-ins and can be up and running in a few seconds.
What does Power Pivot do?
Power Pivot is the tool which connects databases, Excel tables, CSV files and other data sources, then enables calculation, sorting and other data manipulation, before finally being presented in Excel, Power View or Power BI. That all sounds slightly overwhelming and confusing, doesn’t it?
It is probably easier to explain what Power Pivot does with a simple example. Imagine you have three data sources:
- Sales data in different currencies stored in a database
- Customer data from a CSV file
- Exchange rate data in an Excel workbook
Your manager asks you to identify the USD value of sales for each customer based in Mexico for a specific year. In the past you may have created a big flat table using lots (and lots) of VLOOKUPs (or INDEX / MATCH if that’s your preference), then used a PivotTable to manipulate the data.
In this scenario, you could instead use Power Pivot to take the data directly from the three sources, create relationships, create measures & KPIs, then push the result into Excel. The difference is subtle but powerful, with Power Pivot:
- The data sources were not put into a spreadsheet, they all remained in their original forms.
- The three data tables remained as three data tables, rather than turned into one massive single table
- There were no VLOOKUPs (or INDEX/MATCH) formulas, as the measures and KPIs are created using new type of formula known as DAX.
The relationships created between the data tables are the core power of Power Pivot. This is called the Data Model, and this is where Power Pivot does all its heavy lifting. The addition of the DAX formulas turns Power Pivot into a flexible tool suitable for almost every data scenario.
While Excel worksheets now have over 1 million rows, that can still be too small. Power Pivot can deal with this size, because the data does not have to be in Excel, it can come directly from other sources. Excel may be the target for the output, but it doesn’t have to be the source of the input, or the calculating engine.
And guess what… just like PowerQuery, you can have one-click refresh!
How difficult is Power Pivot to learn?
The relationships are easy enough to understand. However, the new formula language called DAX (Data Analysis Expressions) take a bit of thinking through. You do not need to be a Power Pivot expert to take large datasets, build robust Data Models and create some powerful reporting, but it might take a bit of time to learn (so stick with it).
Get & Transform and Power Pivot together
It may seem like Get & Transform and Power Pivot achieve similar tasks. They both take input from many sources, they both manipulate data, they both have their own programming languages. Whilst there is some crossover, each tool has its own purpose.
Generally speaking, the difference is:
- Get & Transform is designed to take information (structured or unstructured) and turn it into a usable data layout
- Power Pivot is designed to use data which is in a structured layout to create the table relationships
The benefit comes when both are used together, asGet & Transform can load data into either a spreadsheet or the Power Pivot Data Model.
Power View
Power View is an interactive data visualization tool for creating dashboards and reports. It is a charting layer for the Data Model built within Power Pivot or Power Query. What is interesting is that data can be imported into the Data Model from a variety of sources and displayed within Power View, without ever touching a standard Excel worksheet.
At the time of writing, Power View is only available within the Professional Plus editions of Excel. Therefore it still has a limited audience.
Power View is probably the least adopted tool of the Modern Excel toolkit. It has a similar look to Power BI, but Power BI has continued to be developed where Power View is now being left behind.
In Excel 2013 Power View was included in the Ribbon, but in Excel 2016 it has been relegated to an Add-in. This may be an indication that Microsoft will not be actively developing Power View going forwards.
How difficult is Power View to learn?
Once you’ve mastered the other Modern Excel tools, Power View is easy. It’s primarily a drag and drop interface, with no difficult new programming languages to learn.
Power BI
Power BI is a separate data visualization tool and not part of Excel. It gives a visual Business Intelligence layer to a variety of data sources.
Power BI uses the same Get & Transform tool (though it is not called Get & Transform in Power BI) and the same Power Pivot Tool (though it is not called Power Pivot) to create the Data Model and a similar (but significantly better) Power View type tool to create dashboards and interactive reports. Therefore, all the Modern Excel skills are transferable between Excel and Power BI.
There is a further crossover; having created a Power Pivot Data Model in Excel, it is possible to share that directly with Power BI. Also, Power BI can use Excel as it’s data source. So, whilst they are separate software programmes, they do work well together.
Where to learn Power BI?
Power BI in itself is not too difficult to learn once you’ve mastered Get & Transform and Power Pivot. But these resources may help.
What about Tables?
In Excel 2003 a feature called Lists was introduced, these were soon enhanced and replaced in Excel 2007 with “Tables”.
Tables can be a difficult concept for an Excel user to grasp, as surely everything on a spreadsheet is a “Table”. In my opinion, the critical distinction is that Tables are intended to hold data, in a structured data format, and have more stringent data handling rules (such as each column can only have one header row and must have a unique name).
Tables are not generally mentioned as part of the Modern Excel toolkit. However, Get & Transform works better when spreadsheet data is contained in Tables and will output to a spreadsheet as a Table. Power Pivot works well with Tables and even uses the same structured referencing syntax for calculated columns. So Tables are an integral part of Modern Excel.
If you’ve not yet mastered Tables, then this is the best place for an Excel user to start the Modern Excel journey. A good understanding of Tables will help ease the learning process in later stages.
The good news, is that the Tables learning curve is pretty straightforward, it’s just a different way of thinking about spreadsheets.
Does Modern Excel replace VBA & Macros?
With all this mention of single-click refresh and interactive reports, it may seem that the Modern Excel tools are replacing VBA macros. But this is not the case.
VBA still has a much broader range of automation possibilities. For example, the Modern Excel tools cannot automatically send e-mails, update PowerPoint presentations or display custom UserForms.
For users who only use Macros to consolidate multiple workbooks, or to clean data, then ‘Yes’ these tools may replace the need for macros, but imagine the power of VBA and Modern Excel together, now that is an exciting prospect.
What to do next?
The Excel data revolution is already upon on us. These Modern Excel tools are now in the hands of regular Excel users. My advice, learn how these tools work, and use them in your daily work. Once over the initial learning curve, you will be able to achieve significant efficiencies, which were just not available previously. Now is the time; join the data revolution.
Discover how you can automate your work with our Excel courses and tools.

Excel Academy
The complete program for saving time by automating Excel.

Excel Automation Secrets
Discover the 7-step framework for automating Excel.

Office Scripts: Automate Excel Everywhere
Start using Office Scripts and Power Automate to automate Excel in new ways.


Hi Mark! Welcome back. This post is a very useful overview of the Power “Universe”. I’ve sent a link to one of my clients as a resource. She is thinking of taking some Power Query courses.
M is for (Data) Monkeys is absolutely the best book out there, right now! Also, Ken Puls’ blog is chock-full of articles, commentary and rabbit-hole-worthy links to even more PQ goodness.
Thanks for putting this all in one place.
Cheers,
Mitch